
Here are the 60-minute charts of the major stock indices including some nearby price & trendline support levels which would offer objective long entries on pullbacks to (for those bullish) and/or objective short entries (or stop-loss levels for those long).
Note the recent stark underperformance between the cap-weighted (i.e.- top-heavy in the mega tech stocks) compared to “the stock market” i.e.-all of the other stock indexes including the equal-weighted S&P 500 (RSP) as well as the small (IWM) and mid-caps (MDY, not shown here) which all peaked back in March.
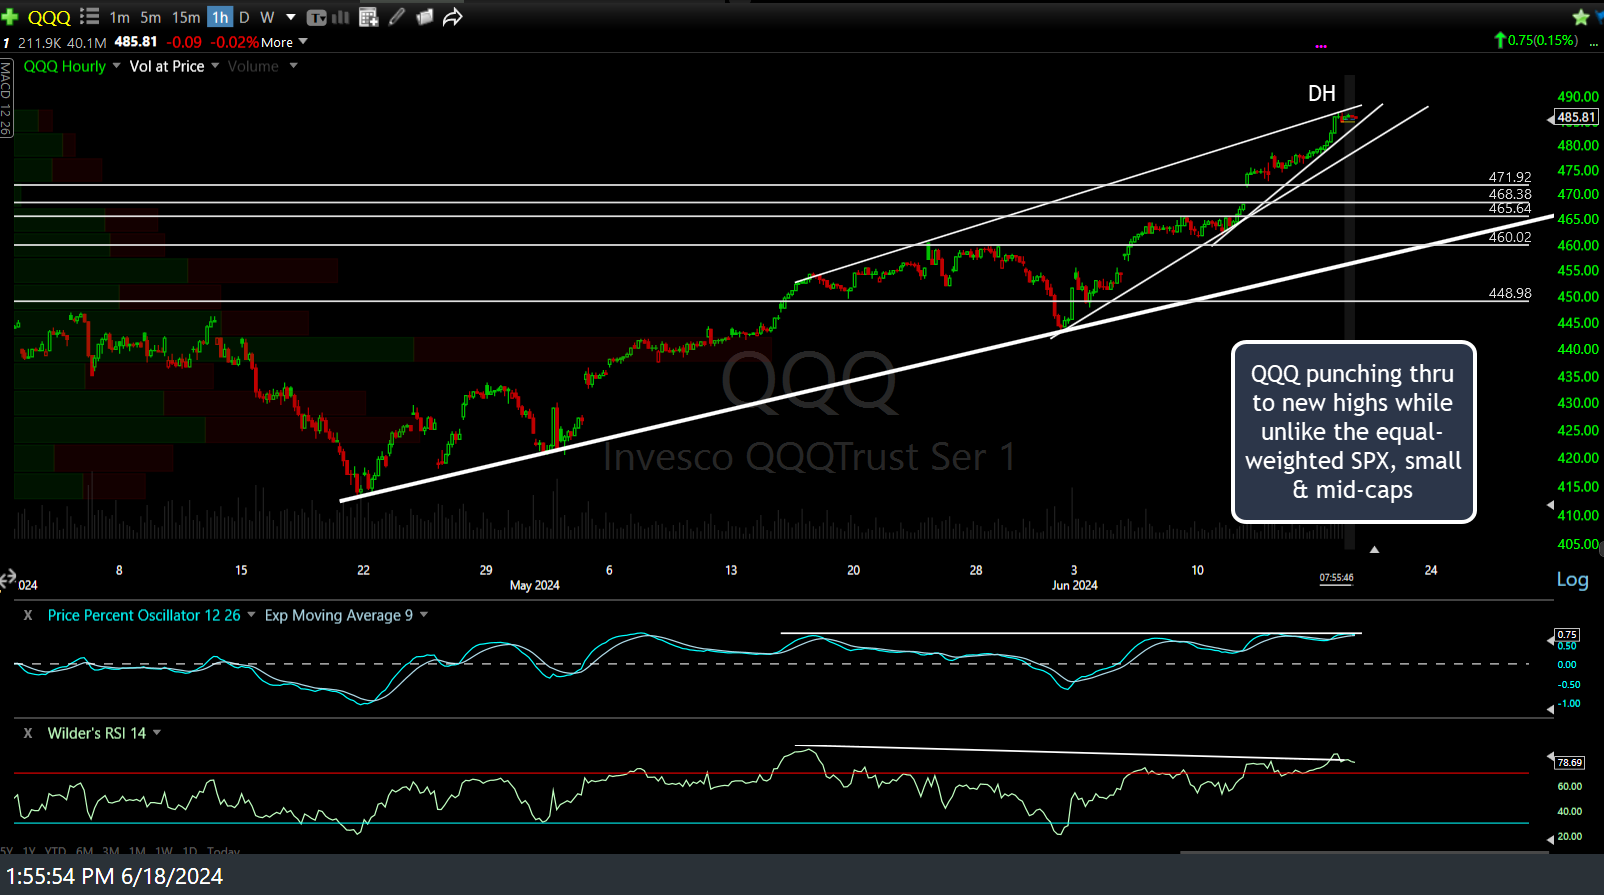
QQQ 60m June 18th
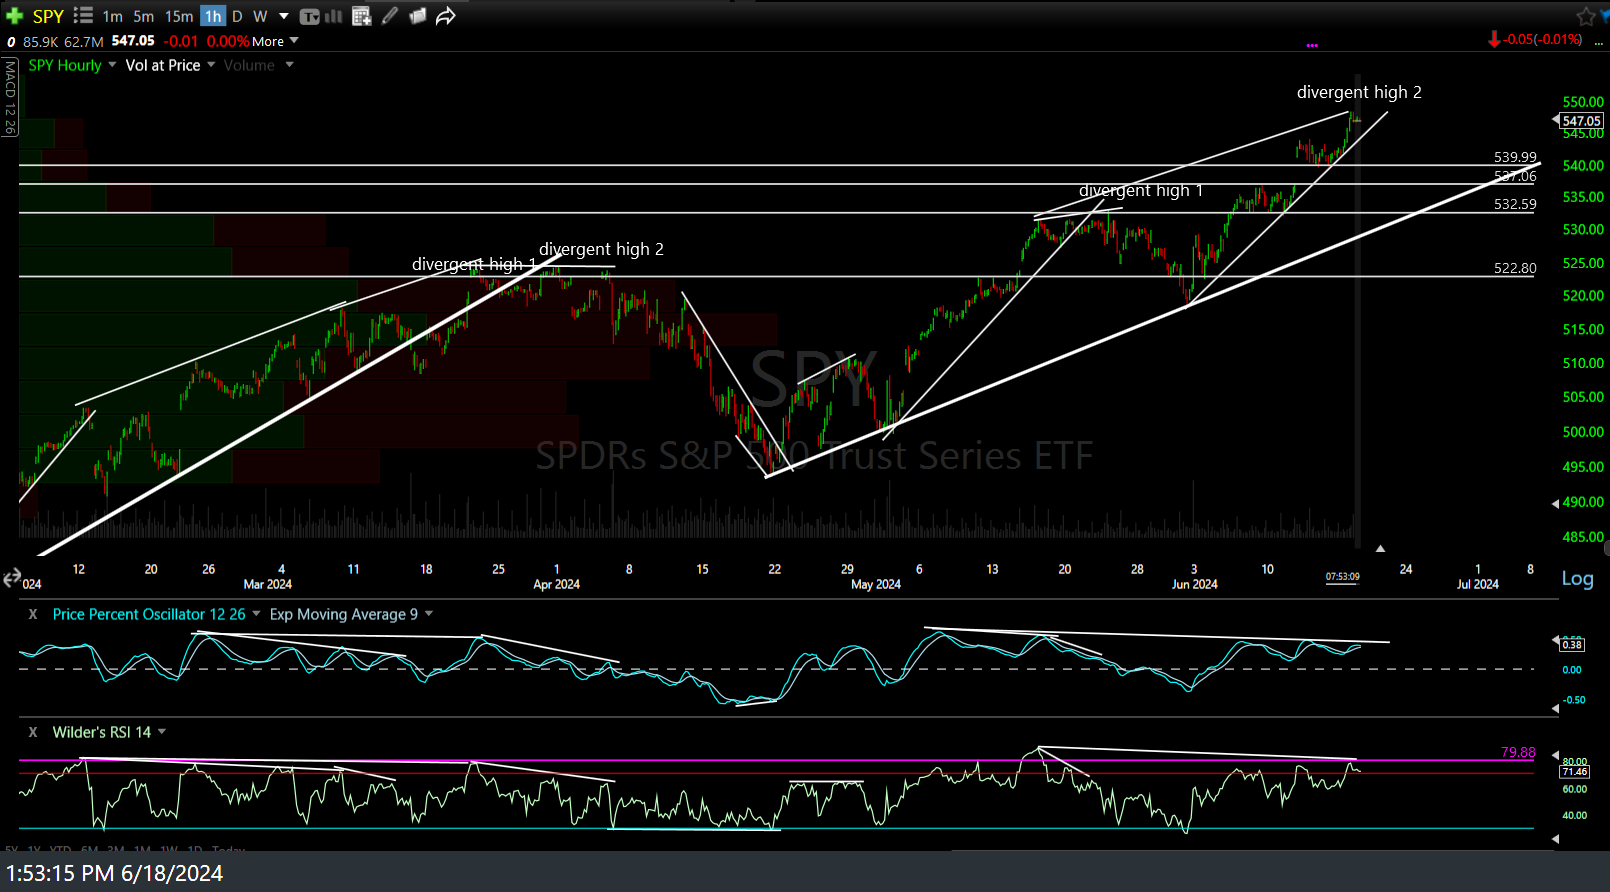
SPY 60m June 18th
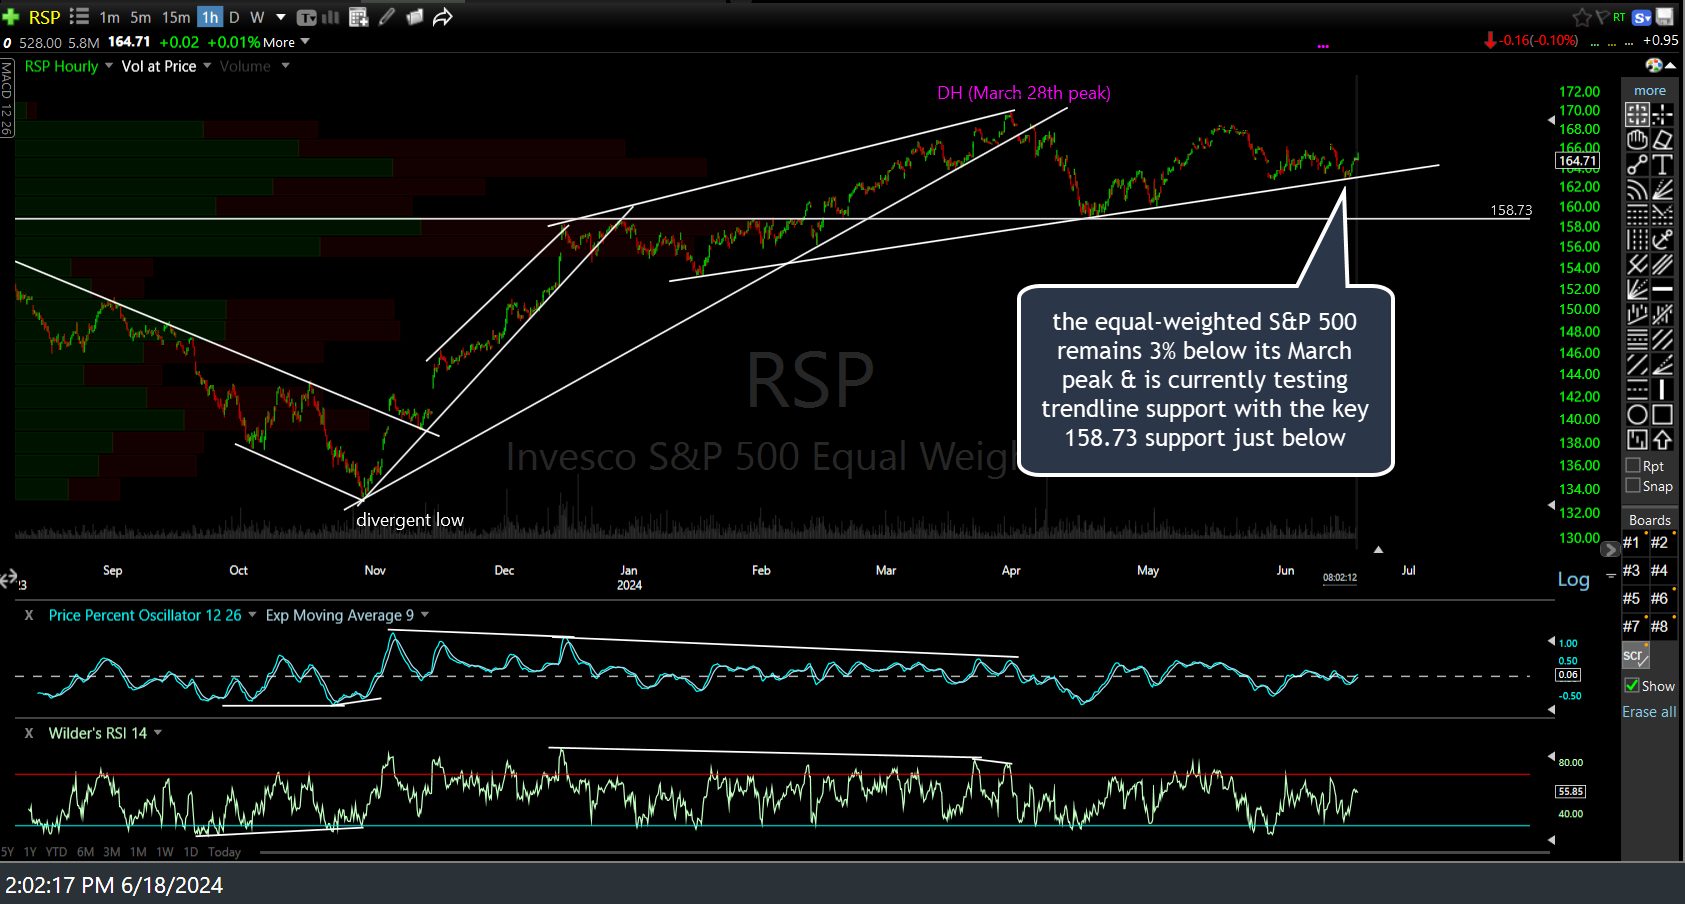
RSP 60m June 18th
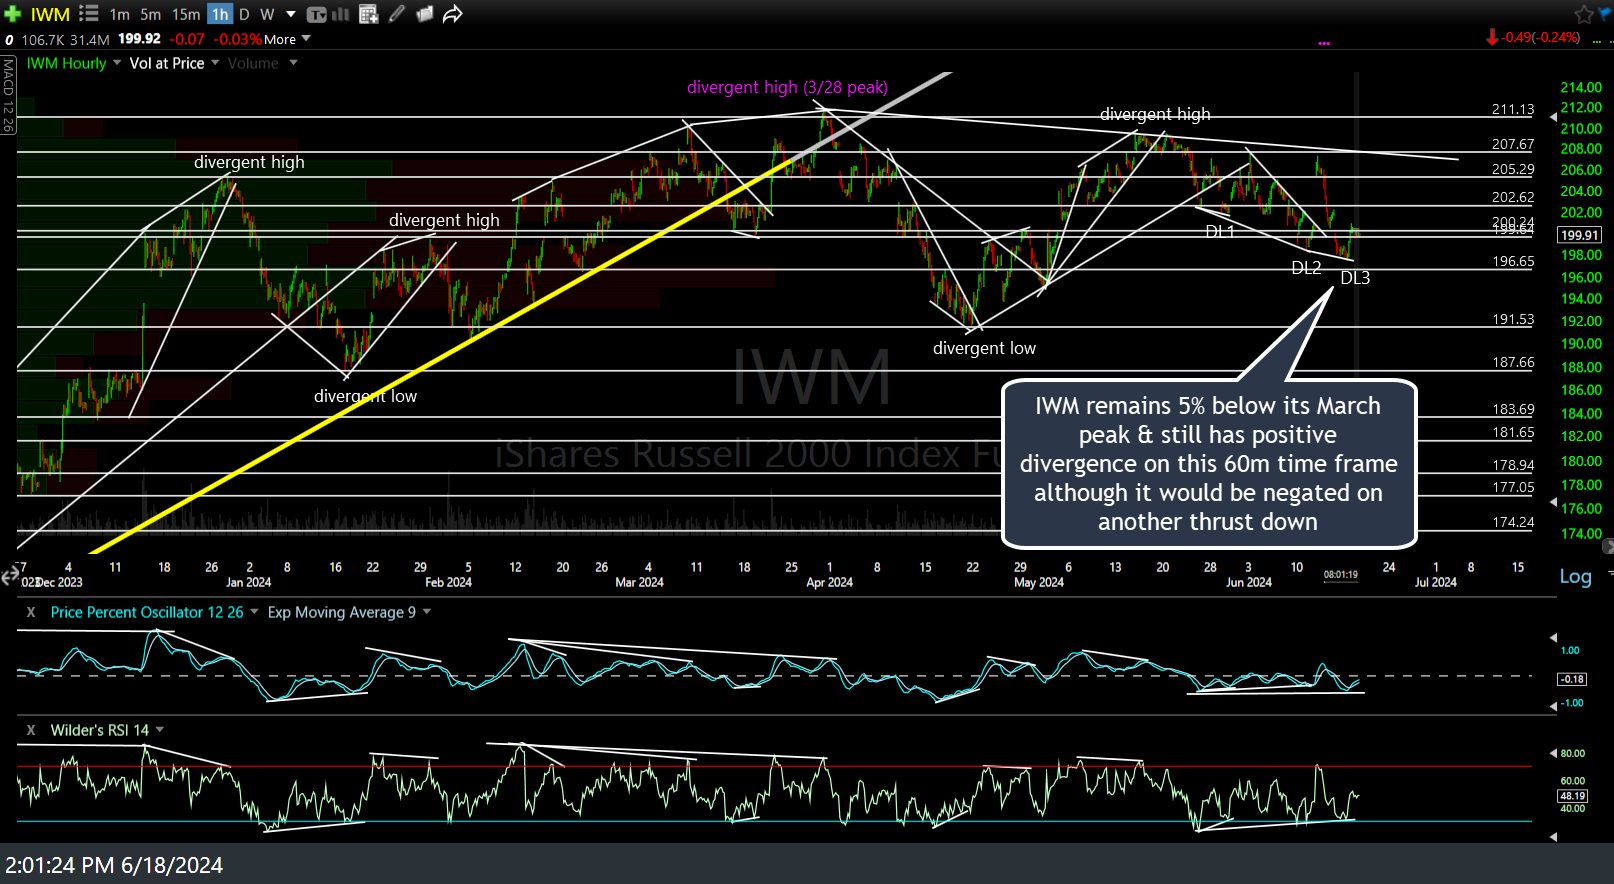
IWM 60m June 18th