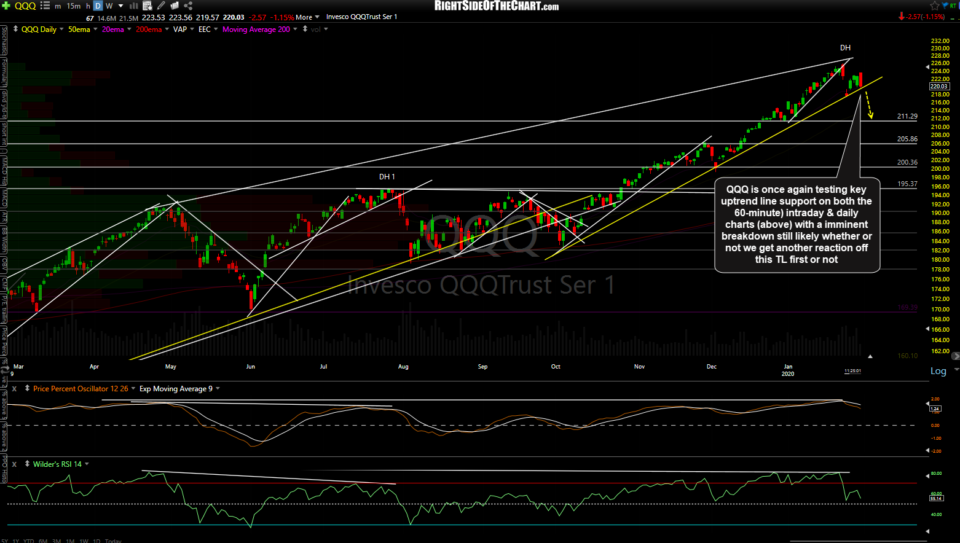
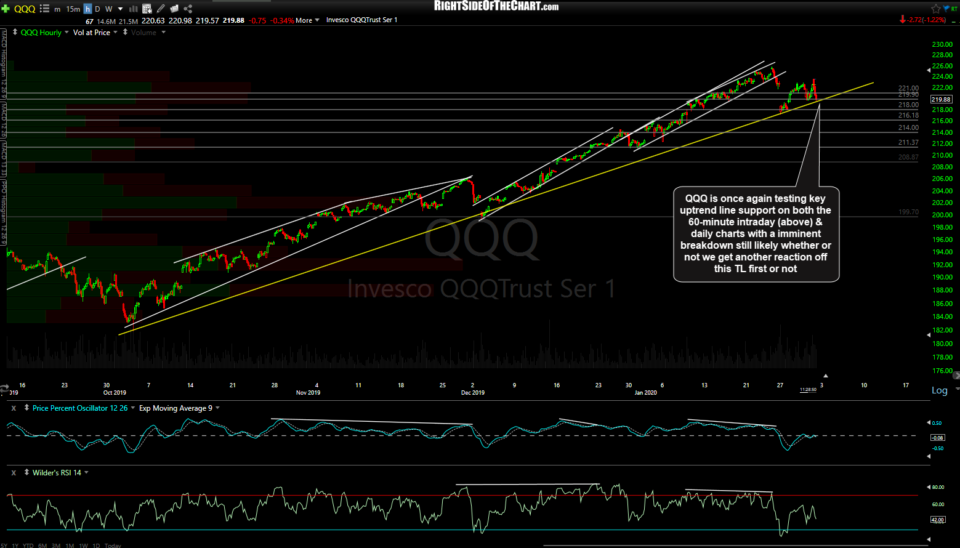
QQQ is once again testing key uptrend line support on both the 60-minute intraday & daily charts (below) with an imminent breakdown still likely whether or not we get another reaction off this TL first or not.
- QQQ daily Jan 31st
- QQQ 60m 2 Jan 31st
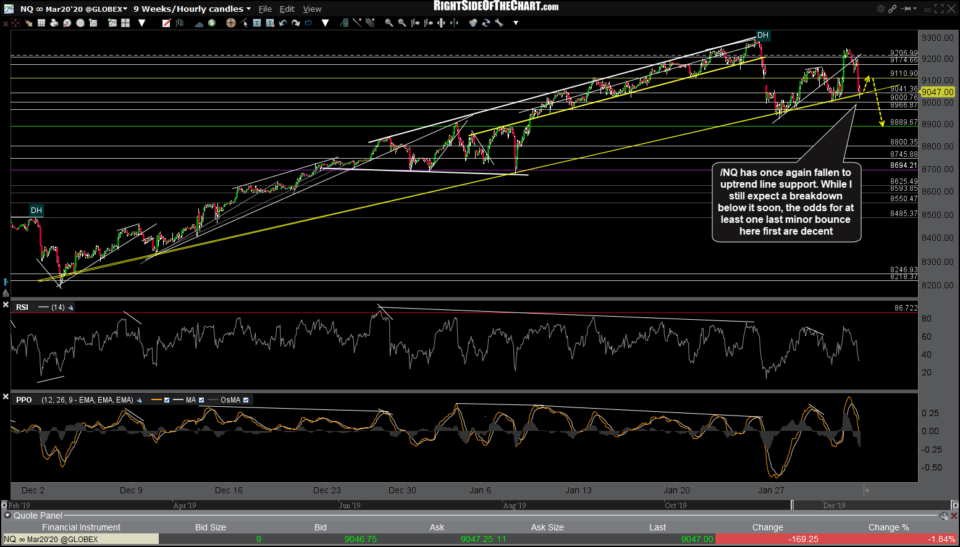
Likewise, /NQ has once again fallen to uptrend line support. While I still expect a breakdown below it soon, the odds for at least one last minor bounce here first are decent. Active traders might opt to reverse a QQQ or /NQ position from short to long here with a stop somewhat below, in an attempt to game a short-term bounce while typical swing traders might be best holding tight on any existing or pending short positions while waiting for a solid break and/or 60-minute or daily close below these trendlines before adding to or initiating a short position.
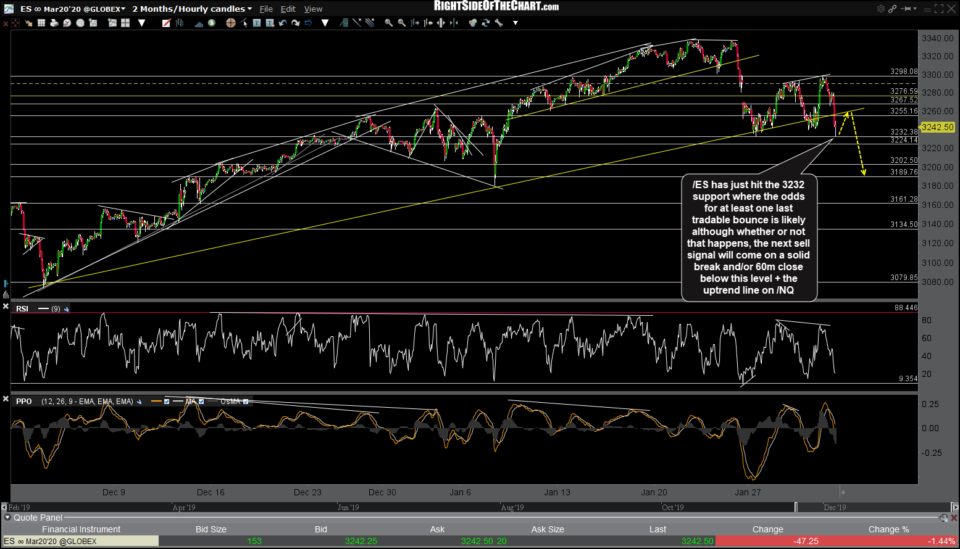
/ES (S&P 500 futures) has also just hit the 3232 support where the odds for at least one last tradable bounce are decent although whether or not that happens, the next sell signal will come on a solid break and/or 60m close below this level + the uptrend line on /NQ. 60-minute chart below.
Keep in mind that with the recent extreme overbought conditions coupled with bearish technical postures on the major stock indexes as well as nearly all of the top components of the large-cap indexes, we could very well smash right through these support levels with little or no reaction first. The key is to be flexible, if actively trading or patient, if swing trading (wait for the next solid sell signal if bearish or go long here at support with a stop somewhat below if looking for new highs & beyond on the indexes and/or FAAMG stocks).


