
A sell signal on the major stock indexes will come on solid breaks below the bearish rising wedges on these 60-minute charts of the major stock index ETFs & futures (SPY, QQQ, /ES, & /NQ). Initial targets/support levels are shown at arrow breaks. Tip: Click on any chart to expand, once expanded, charts can be panned & zoomed.
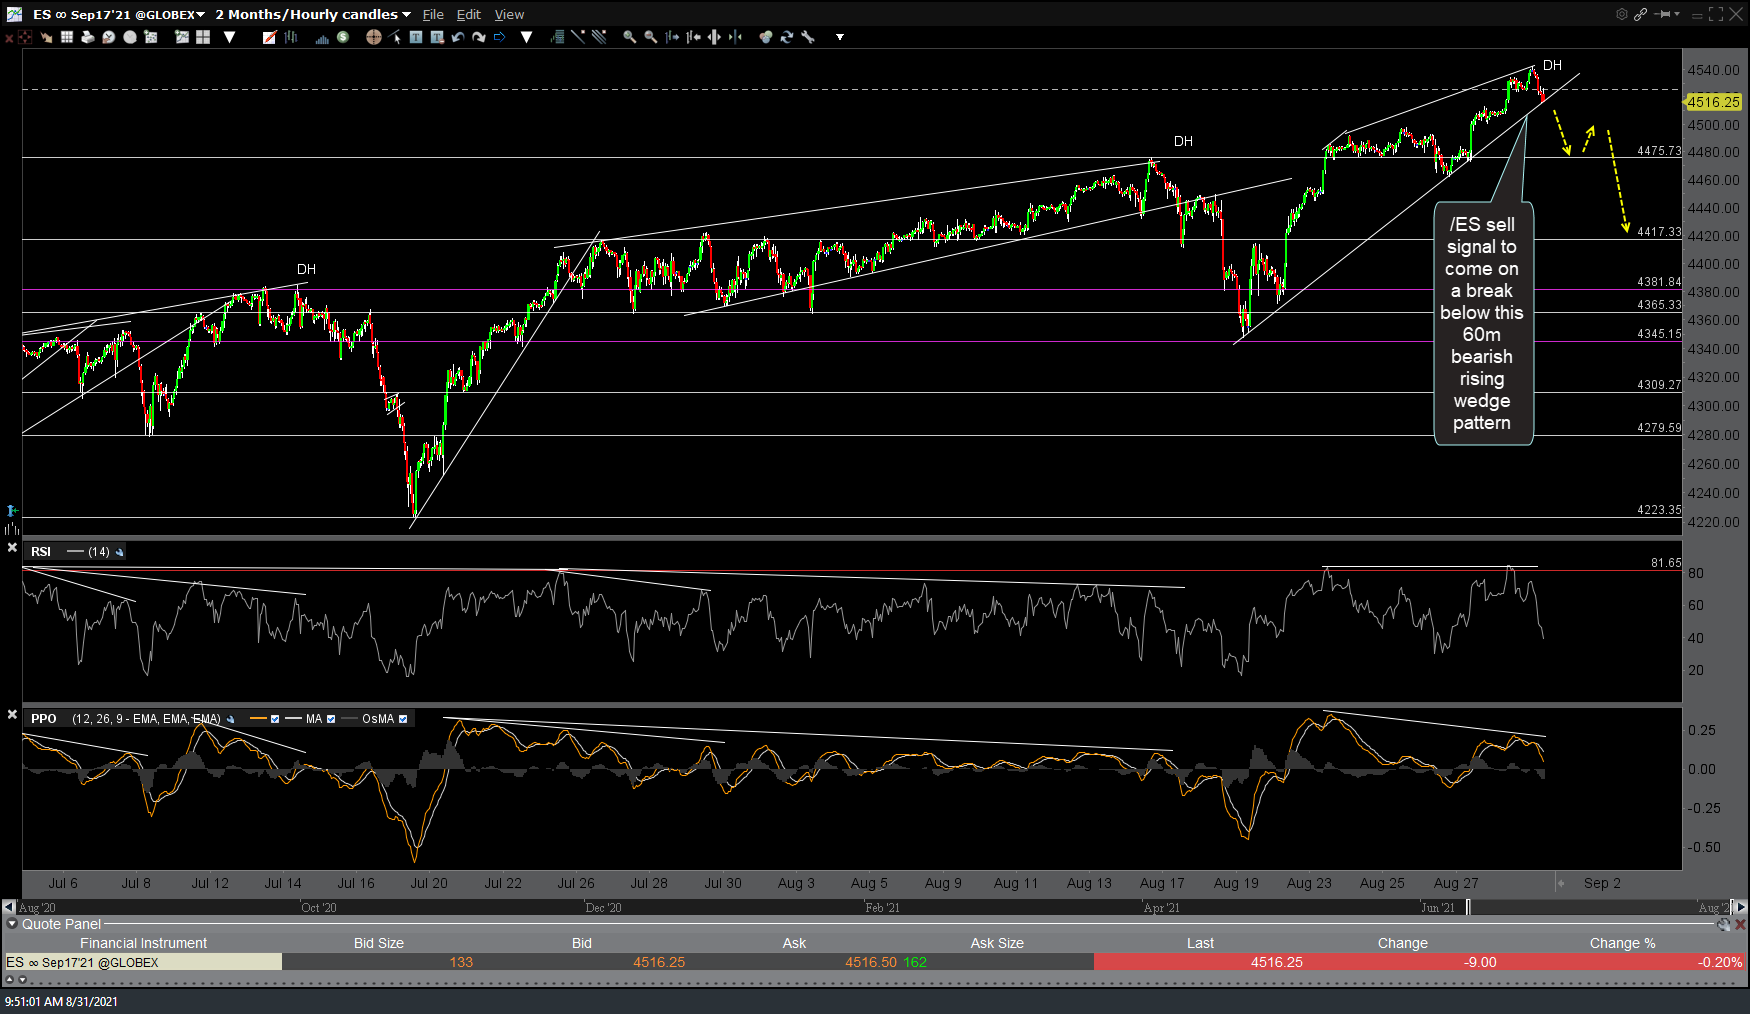
ES 60m Aug 31st
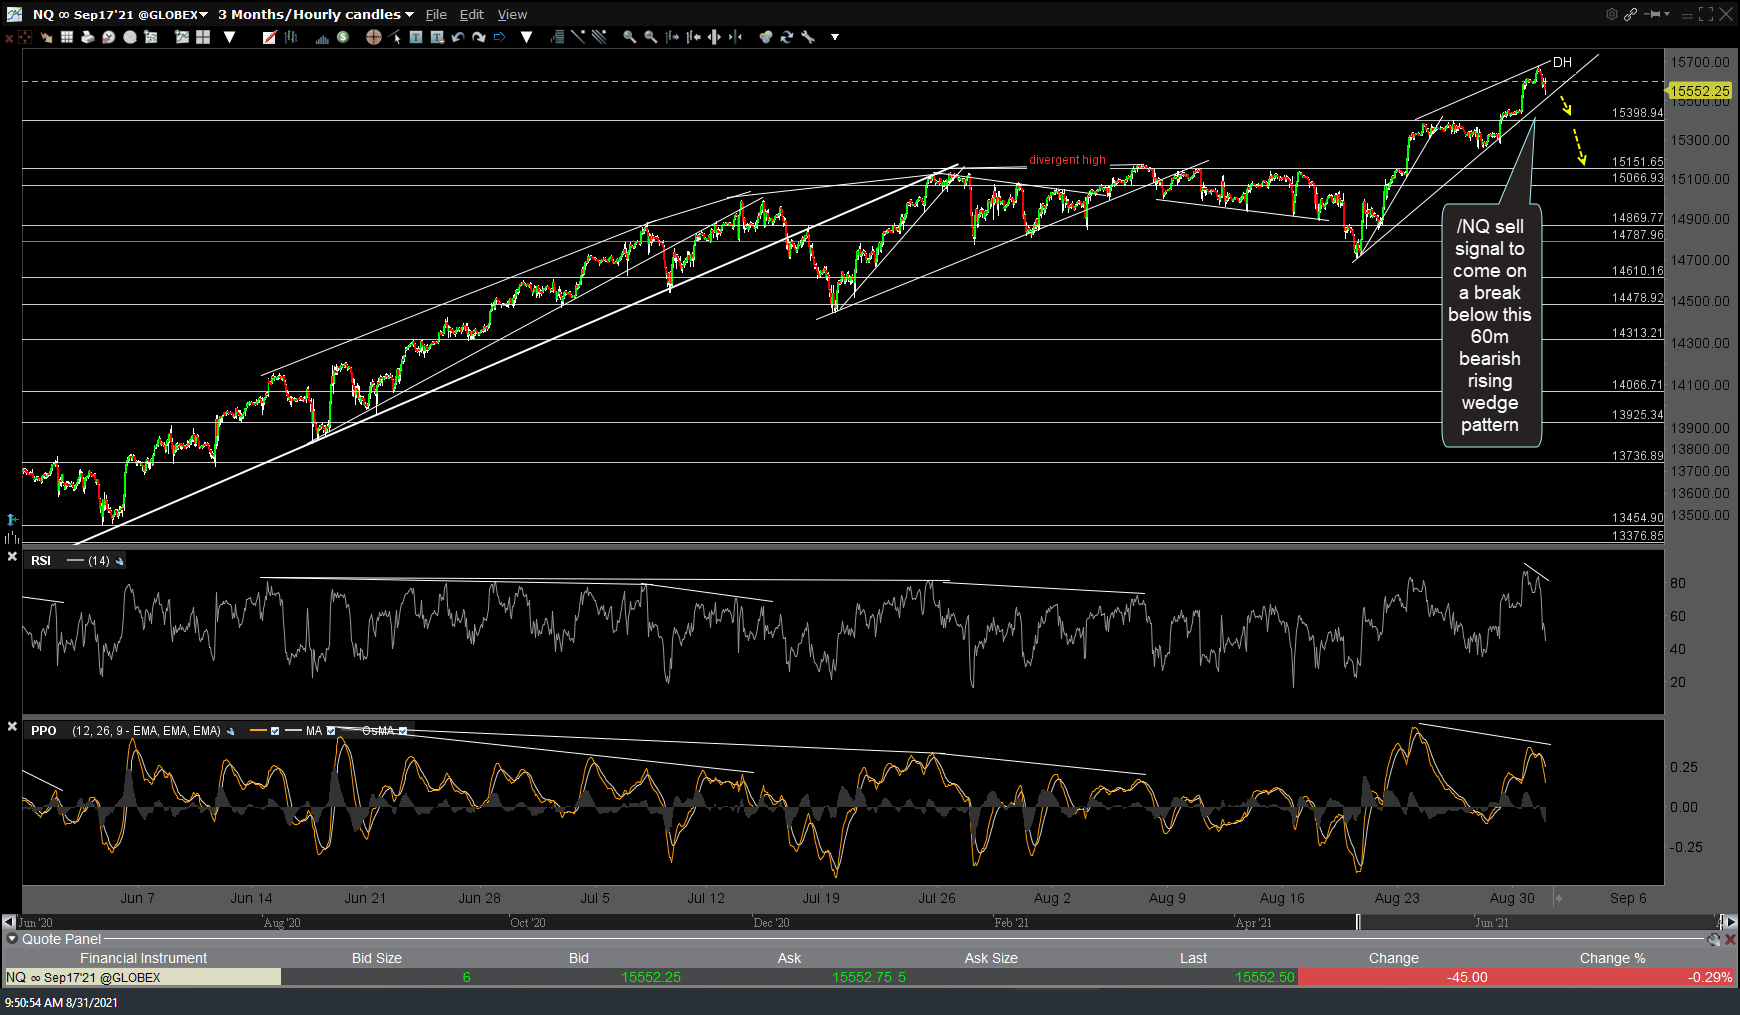
NQ 60m Aug 31st

SPY 60m Aug 31st

QQQ 60m Aug 31st