
The 60-minute charts of /ES (S&P 500 E-mini futures) and /NQ (Nasdaq 100 E-mini futures) below list some of the nearby support & resistance levels as well as my preferred scenario at this time. On /NQ, I’m looking for something along these lines with a bounce to 8000ish resistance level followed by a break of the small wedge & then the larger wedge (thicker uptrend line). Whether we get a trust up to or above 8000, barring any solid bearish candlestick reversal pattern, the first sell signal will come when both /NQ & /ES break below their respective minor uptrend lines followed by a much more significant sell signal on a break below the larger trendlines below.
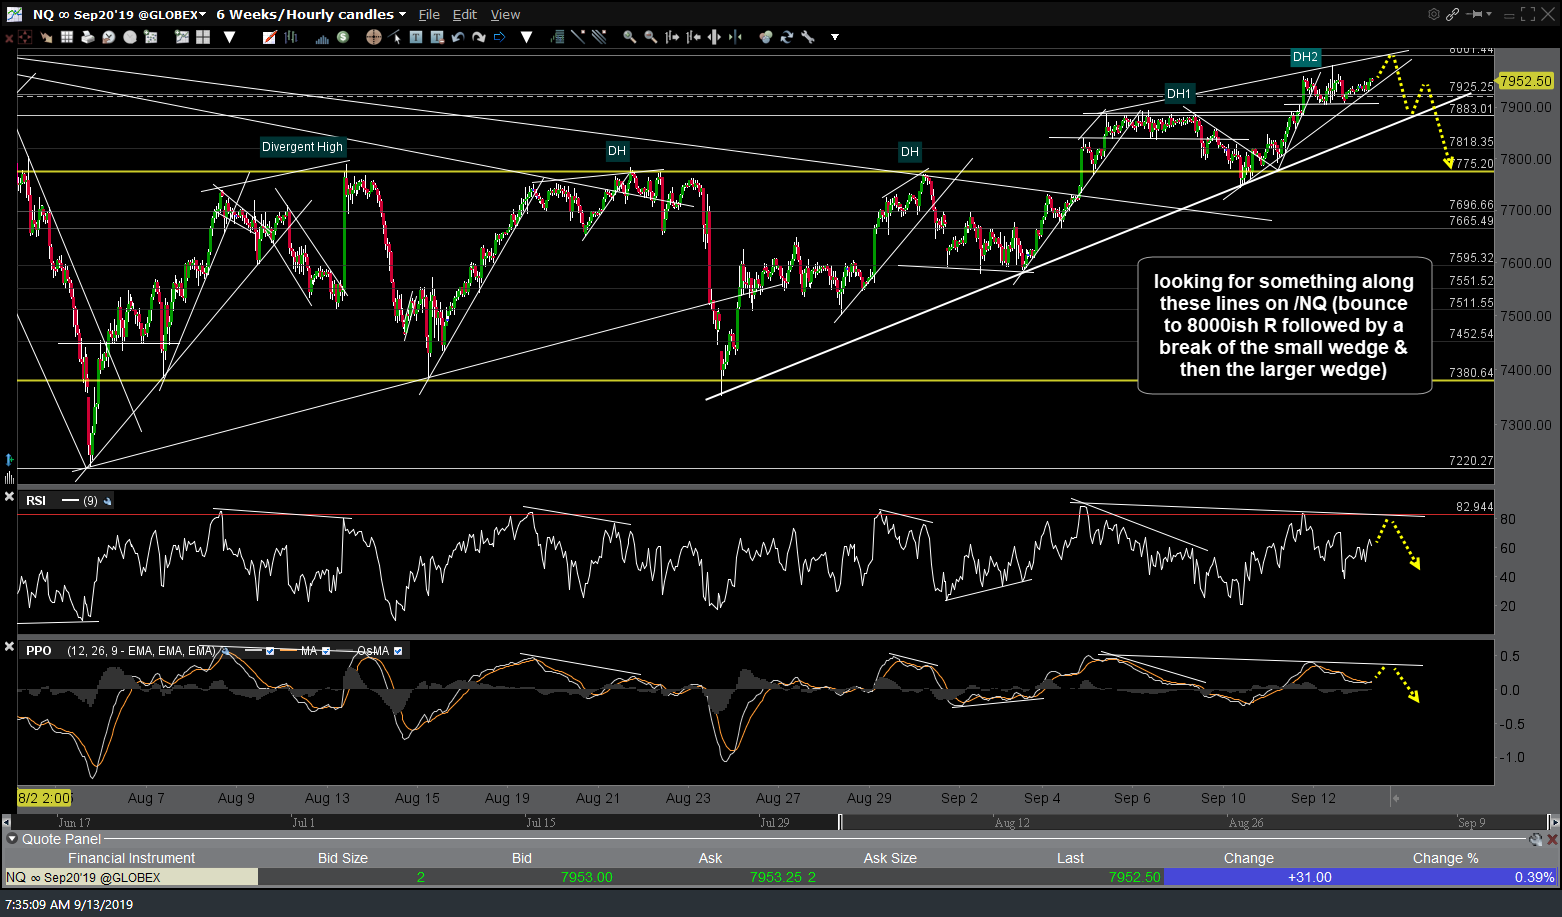
NQ 60m Sept 13th
Likewise, I’m looking for something along these lines on /ES (rally to another marginal new high followed by a break of the small wedge & then the larger wedge). I’ll follow up with the 60-minute charts of SPY & QQQ later today after the regular trading session is underway.
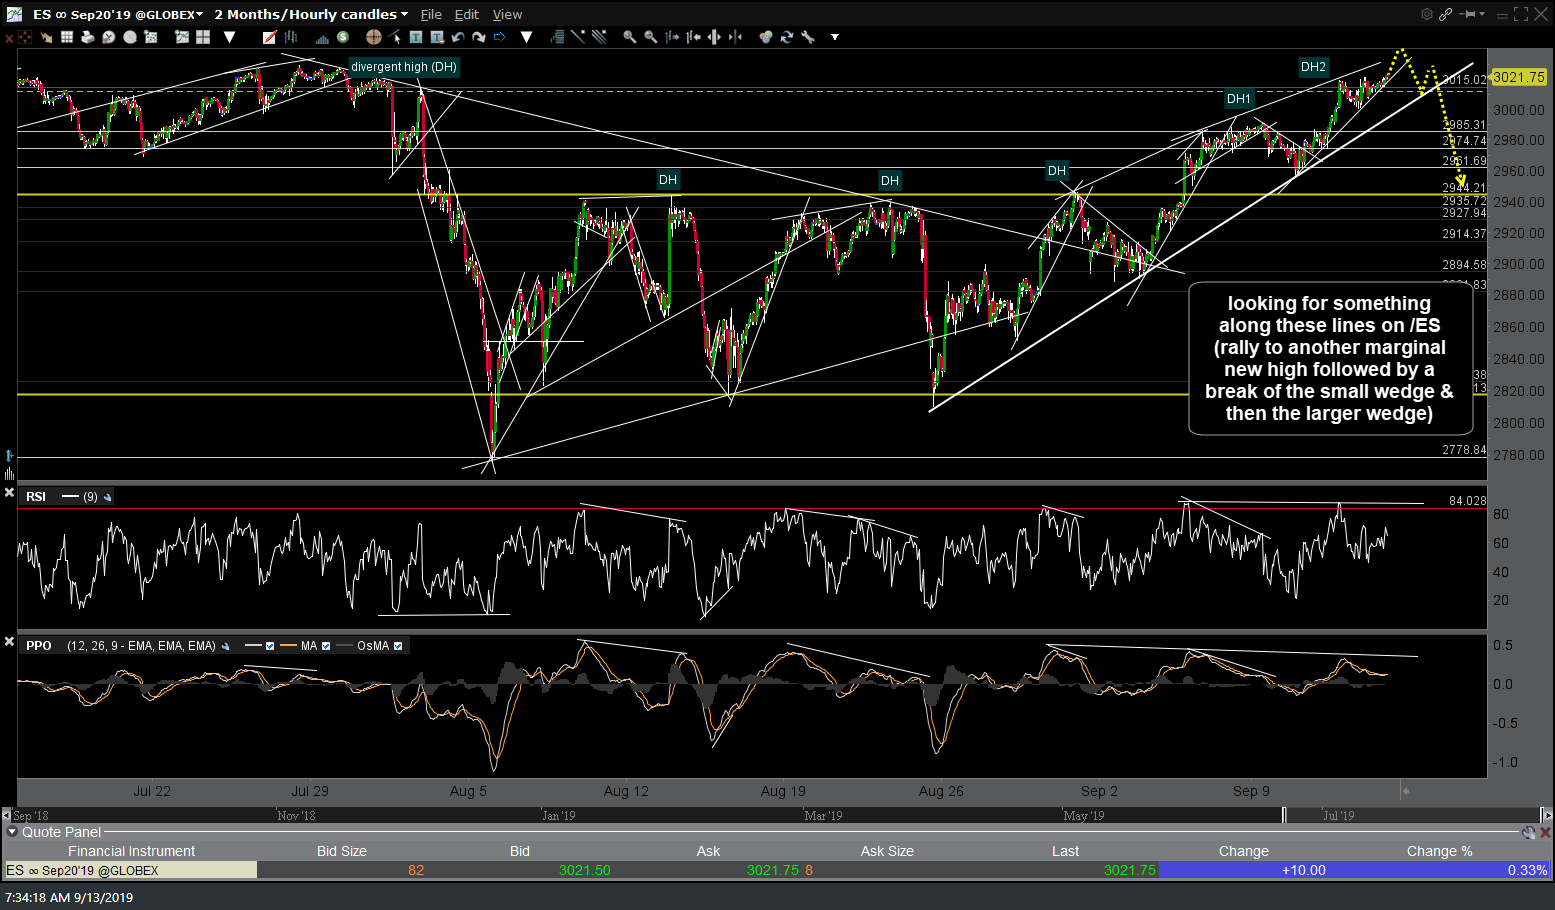
ES 60m Sept 13th