Now that we have negative divergences on the 60-minute charts of the major stock indices, here are a few charts with potential sell triggers & price targets for futures traders (or ETF traders that want to use these charts to align entries & exits).
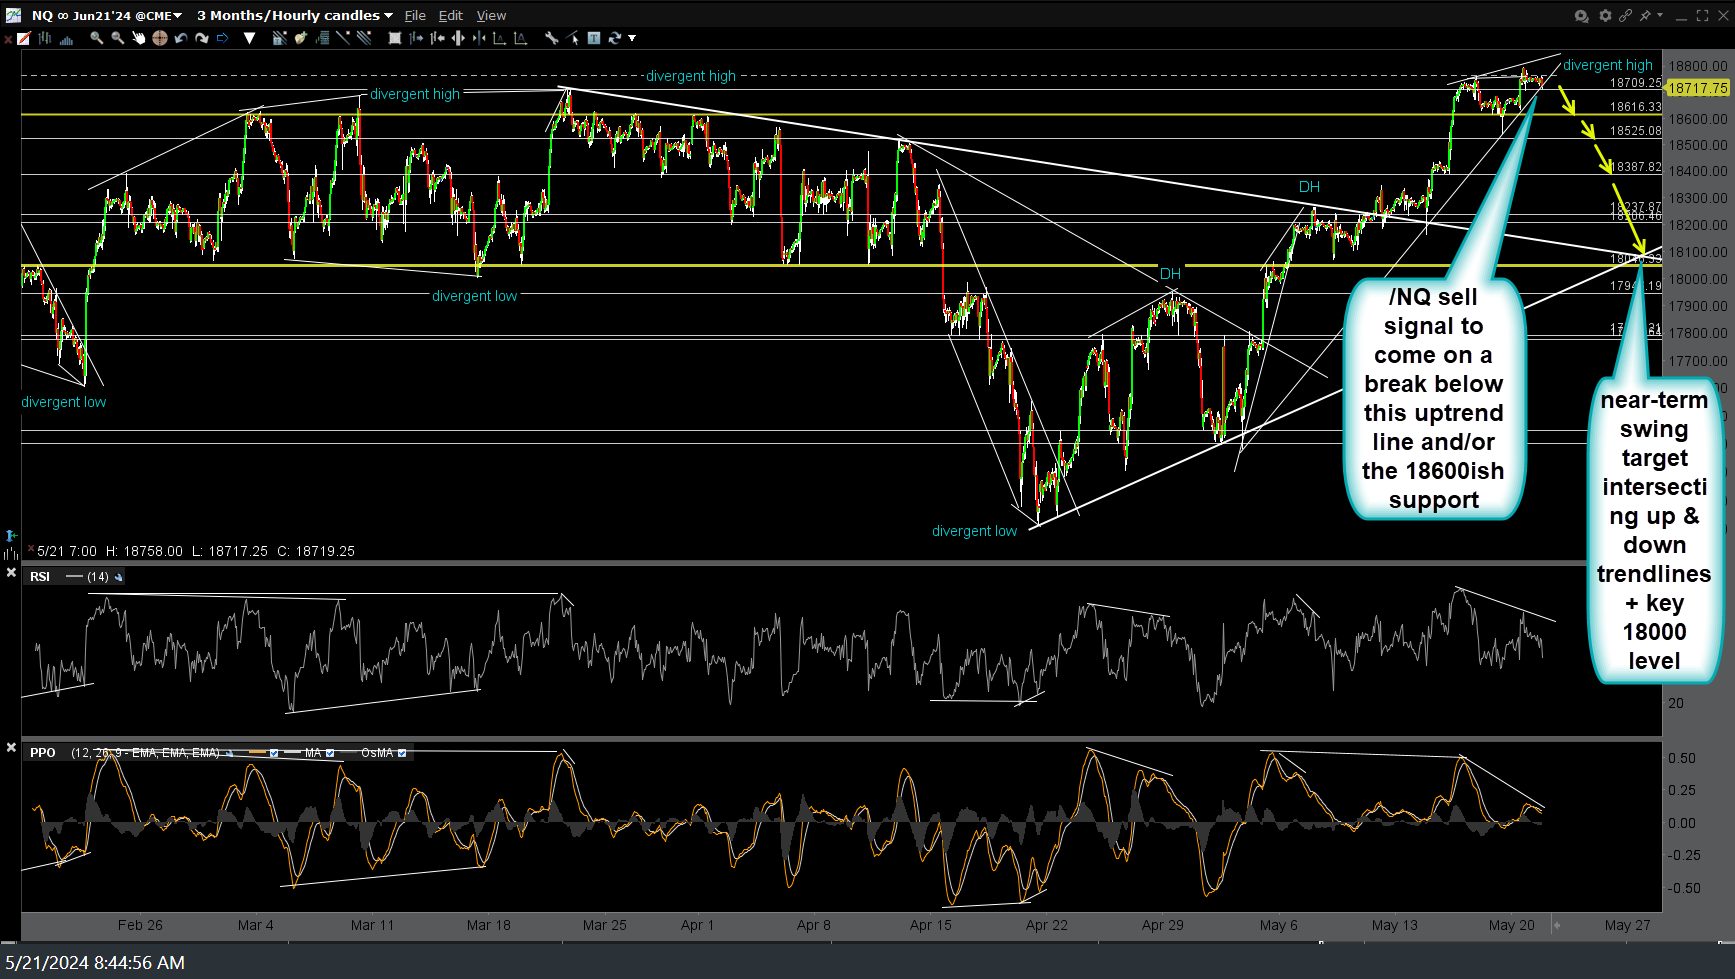
/NQ (Nasdaq 100 futures or QQQ) sell signal to come on a break below this uptrend line and/or the 18600ish support. Arrow breaks denote likely reactions (i.e.- potential active trader targets) with a current near-term swing target of the intersecting up & down trendlines + key 18000 level.
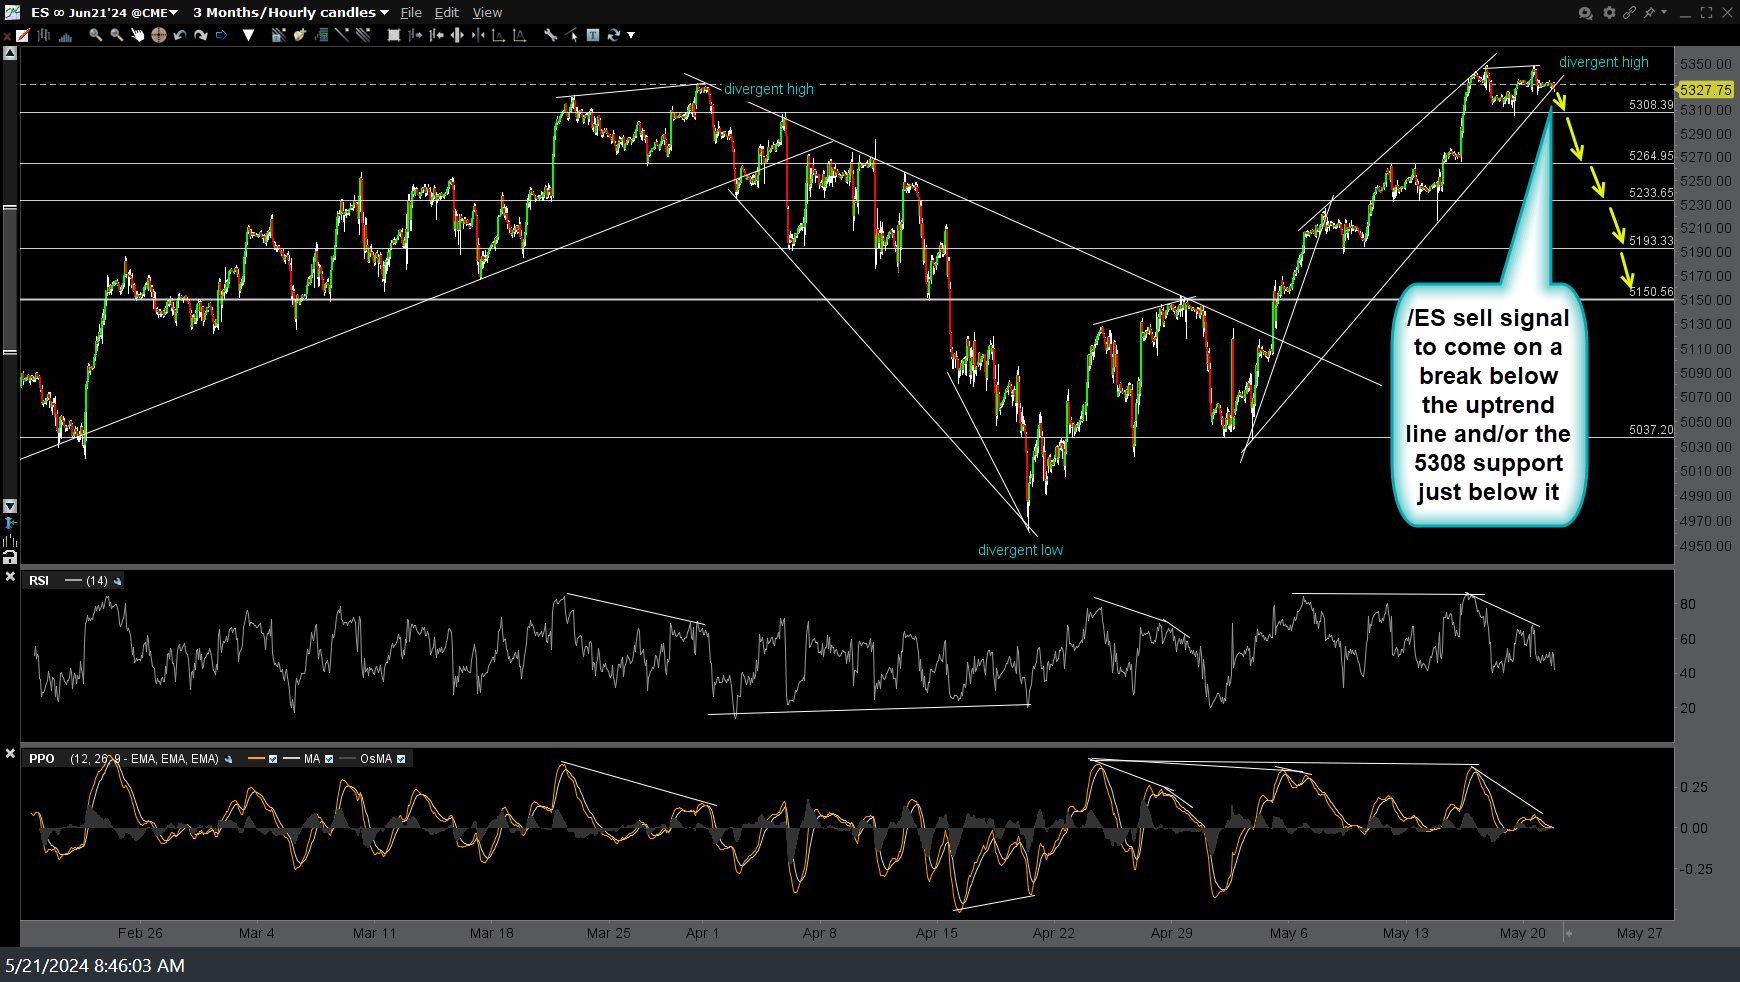
As always, best to confirm any buy or sell signals on the $NDX or $SPX with both indices breaking out above/below comparable resistance/support levels, even if only trading one or the other. /ES (S&P 500 futures or SPY) sell signal to come on a break below the uptrend line and/or the 5308 support just below it.
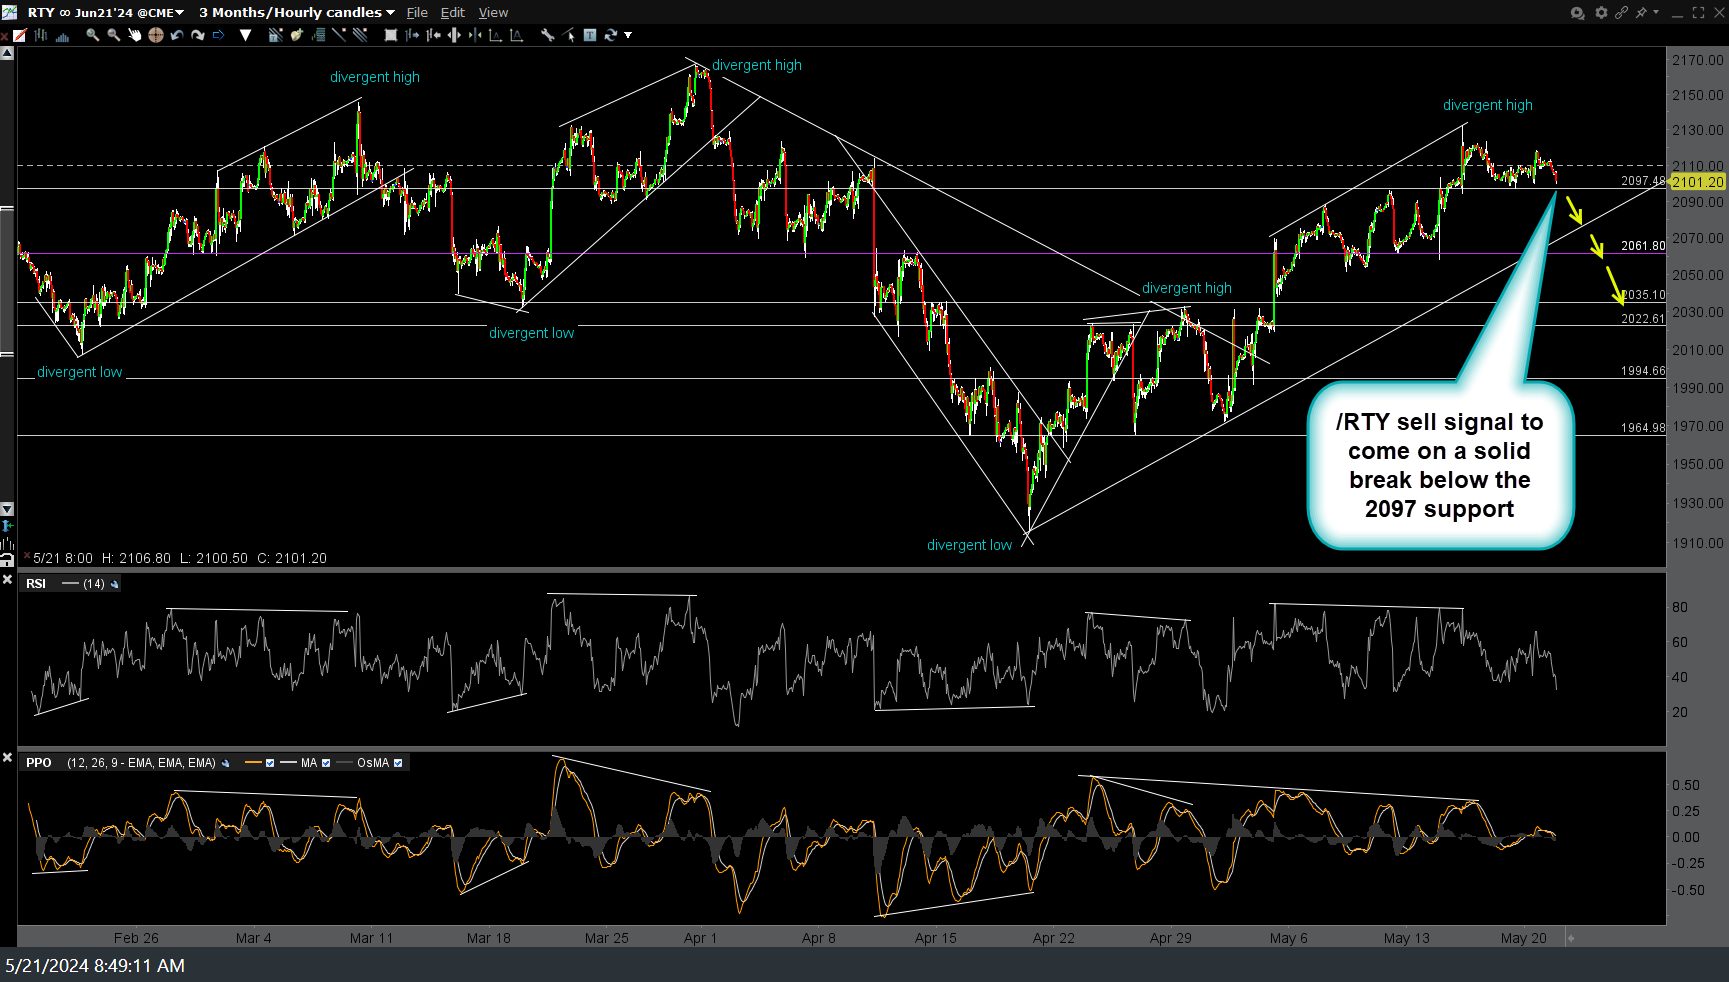
/RTY (Russell 2000 Small-cap Index futures, or IWM) sell signal to come on a solid break below the 2097 support.


