
Following the Nov 9th & 29th sell signals, the next sell signal/objective short entry on QQQ will to come on a solid break below the 390 support level. 60-minute chart below.
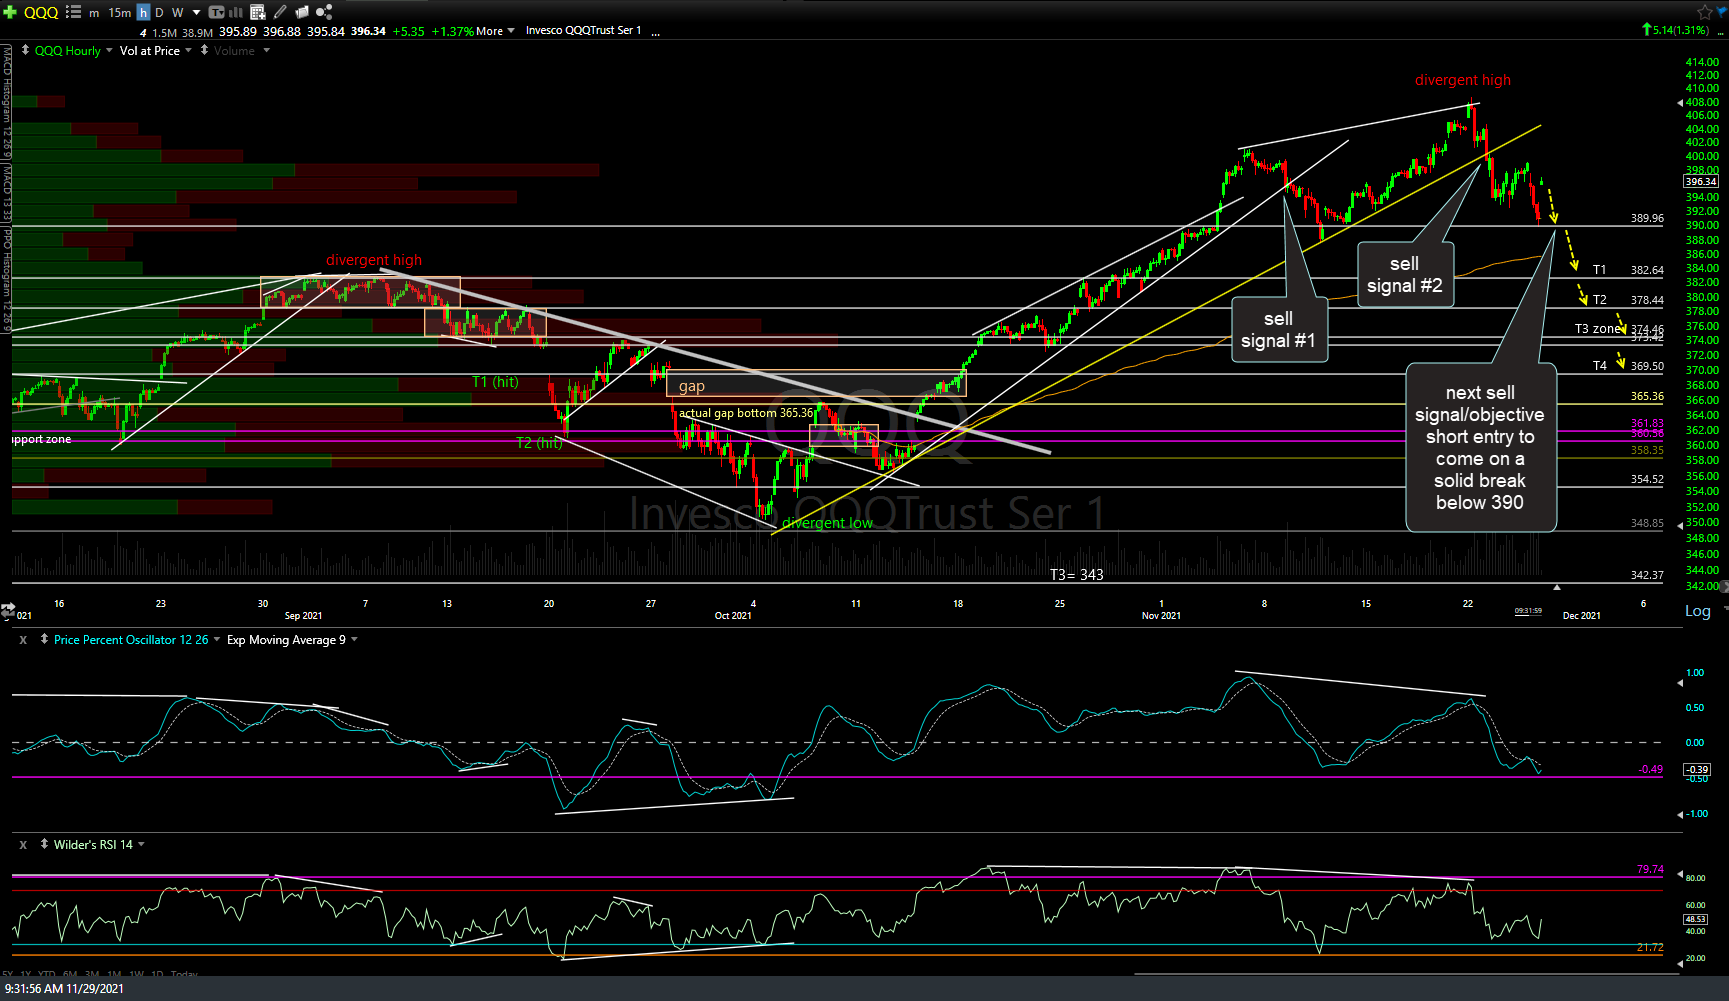
QQQ 60m Nov 29th
/NQ (Nasdaq 100 futures) continues to zig-zag its way down towards the 15932 support & 3rd uptrend line following the most recent divergent high & 2nd sell signal this month. 60-minute chart:
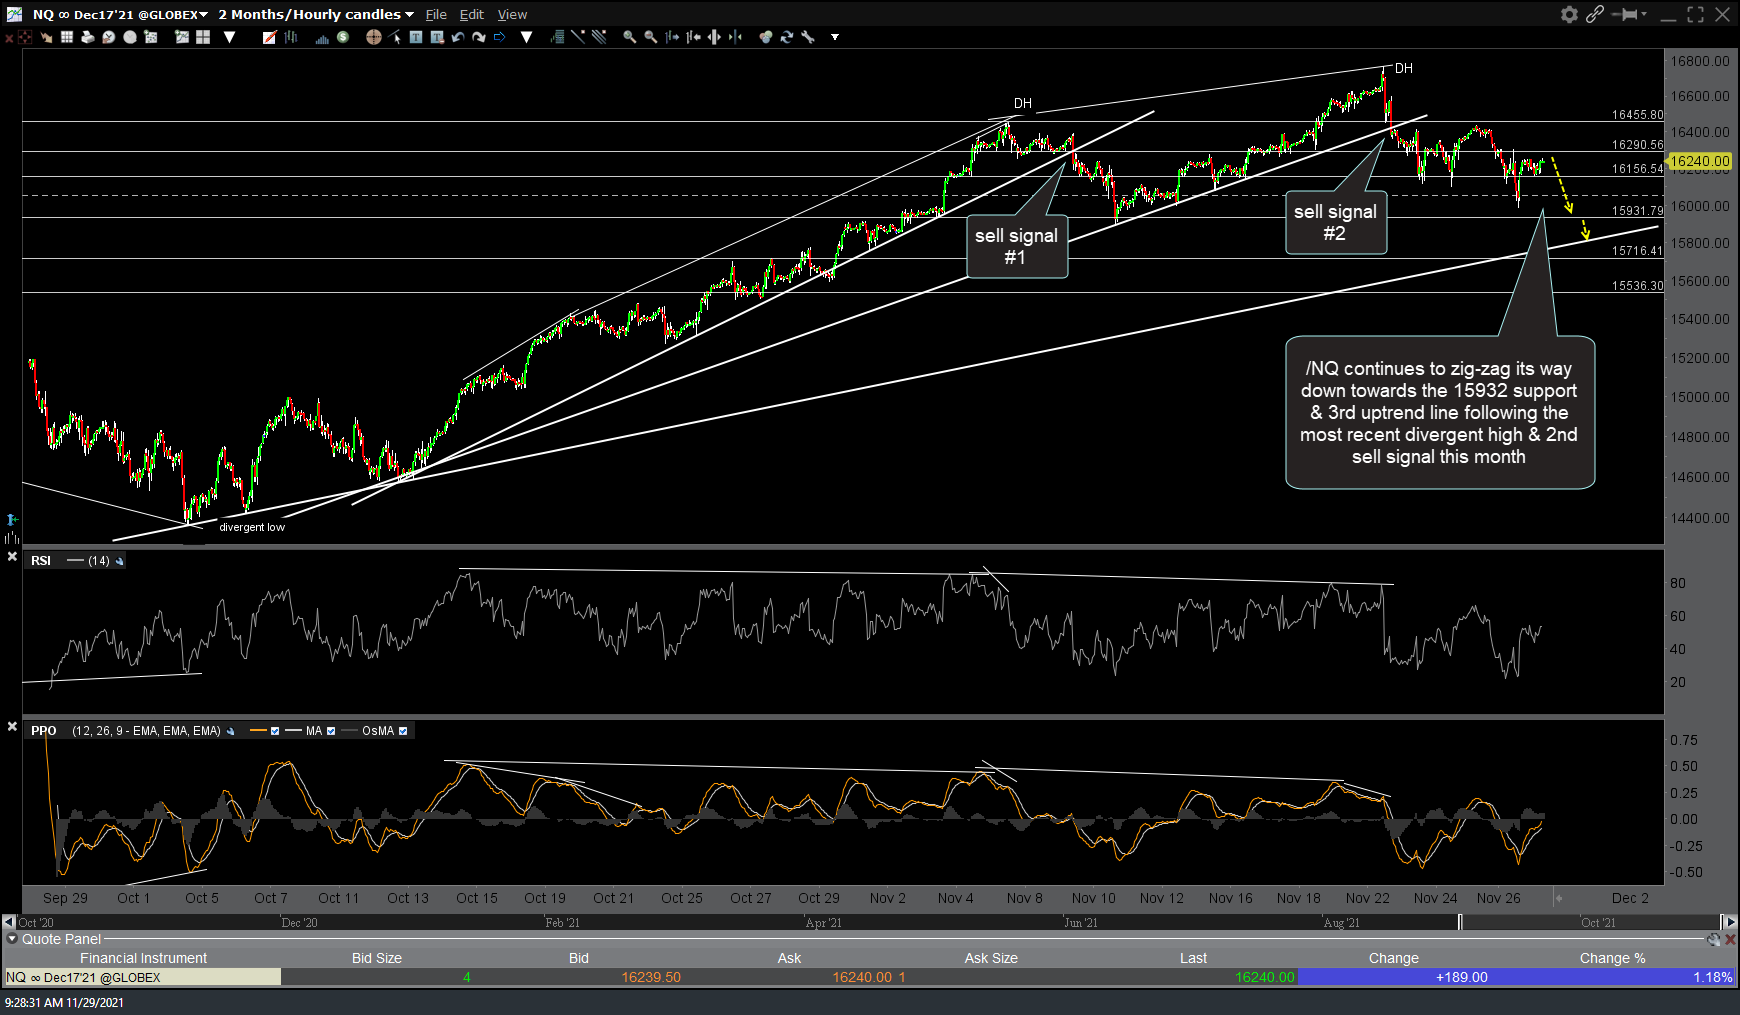
NQ 60m Nov 29th
SPY will offer an objective short entry on a snap-back to 465 and/or a backfill of Friday’s gap. 60-minute chart:
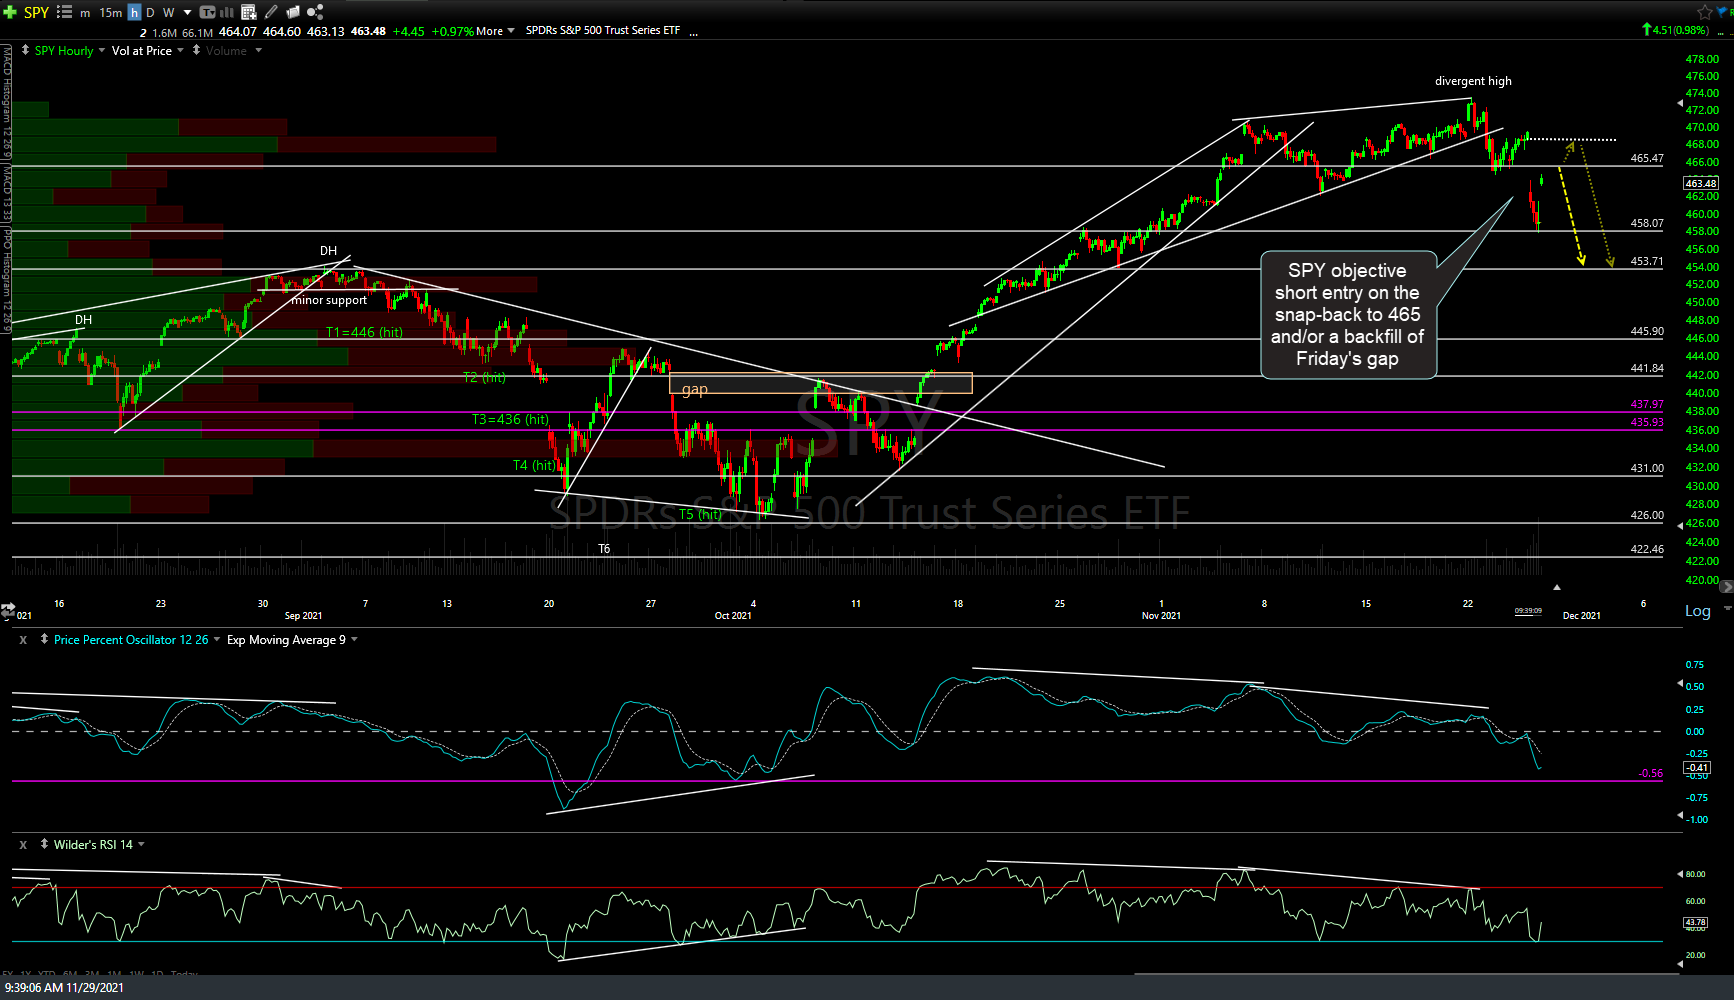
SPY 60m Nov 29th
4587 target on the 60-minute chart of /ES (S&P 500 futures) hit followed by the typical reaction so far. New uptrend line added to this previous reaction low with arrow breaks indicating likely reactions on the next leg down.

ES 60m Nov 29th
While I was away on vacation last week, /RTY (Russell 2000 Small-cap futures) hit my final near-term target (2248) with a brief momentum-fueled overshoot, followed by the typical reaction, so far. 120-minute chart below.
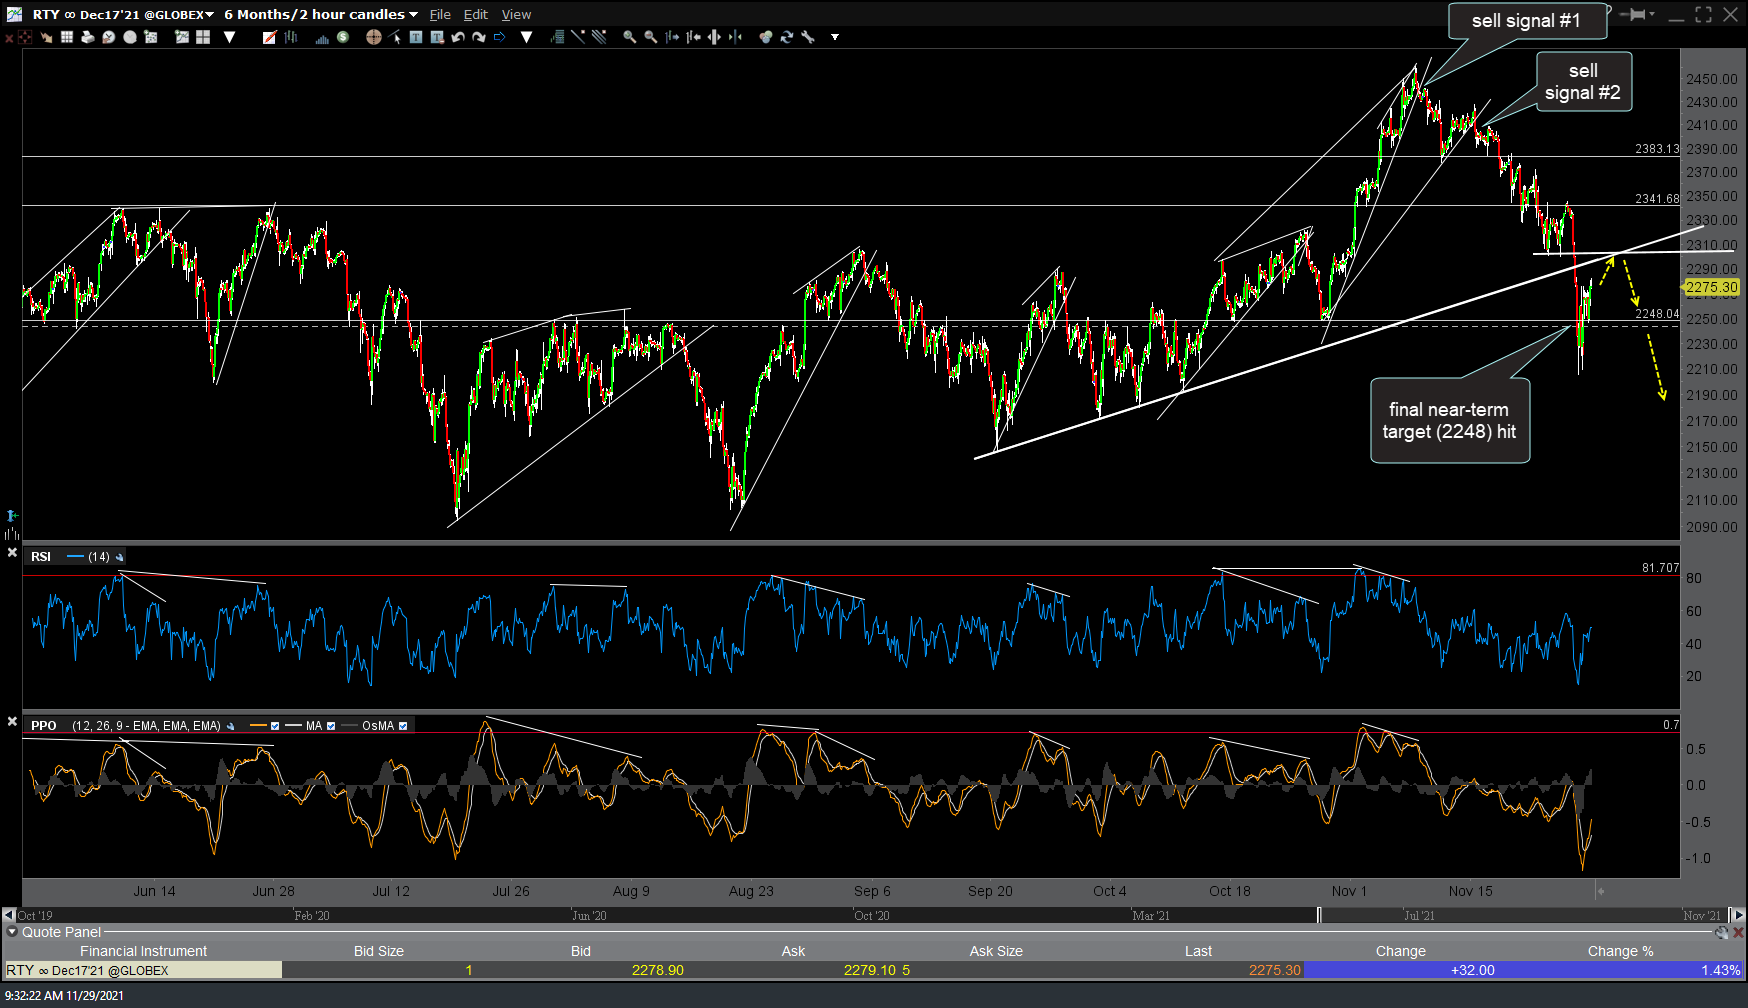
RTY 120m Nov 29th
Likewise, IWM made a near-perfect tag of the uptrend line price target (60-min chart) followed by the typical reaction so far.
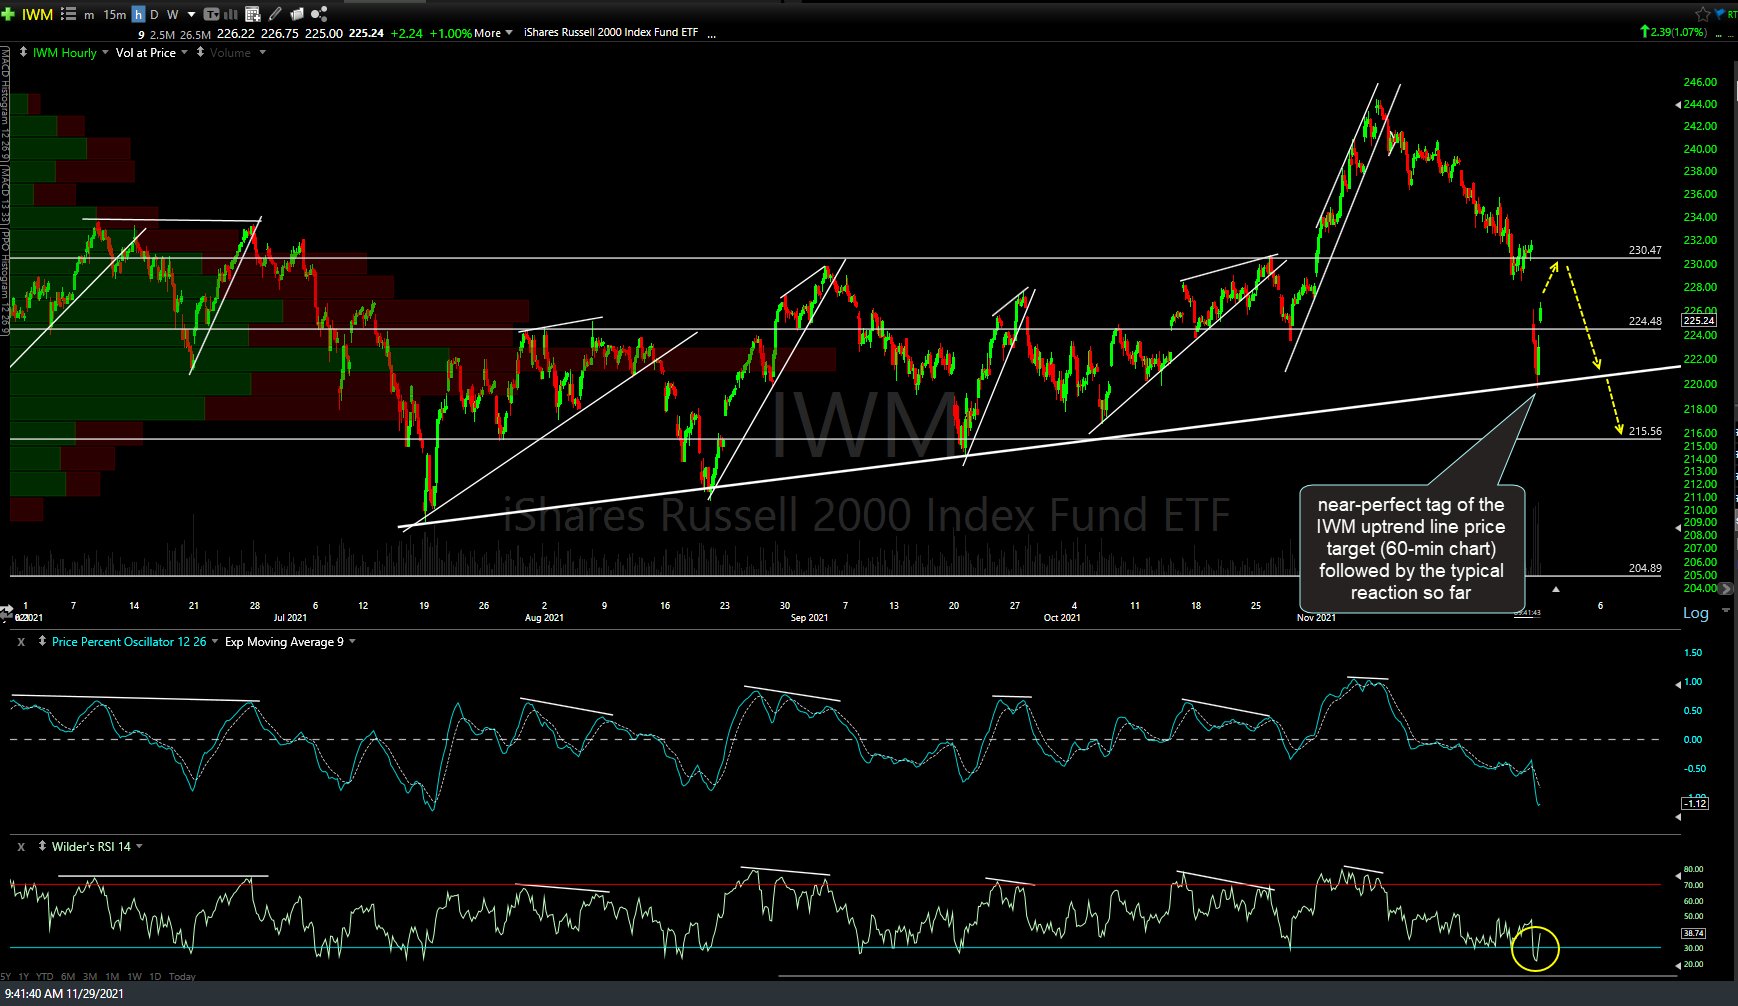
IWM 60m Nov 29th
Bottom-line: The major stock indices are in near-term downtrends following multiple sell signals in recent weeks. As such, any snap-back rallies into resistance levels will provide objective shorting opportunities as the charts still appear to indicate that more downside is likely at this time.
It is also worth noting that both SPY & QQQ printed bearish engulfing candlesticks last Monday while I was out on vacation with both indexes moving lower since then, which helps to confirm Monday’s candles as potential topping/reversal sticks.