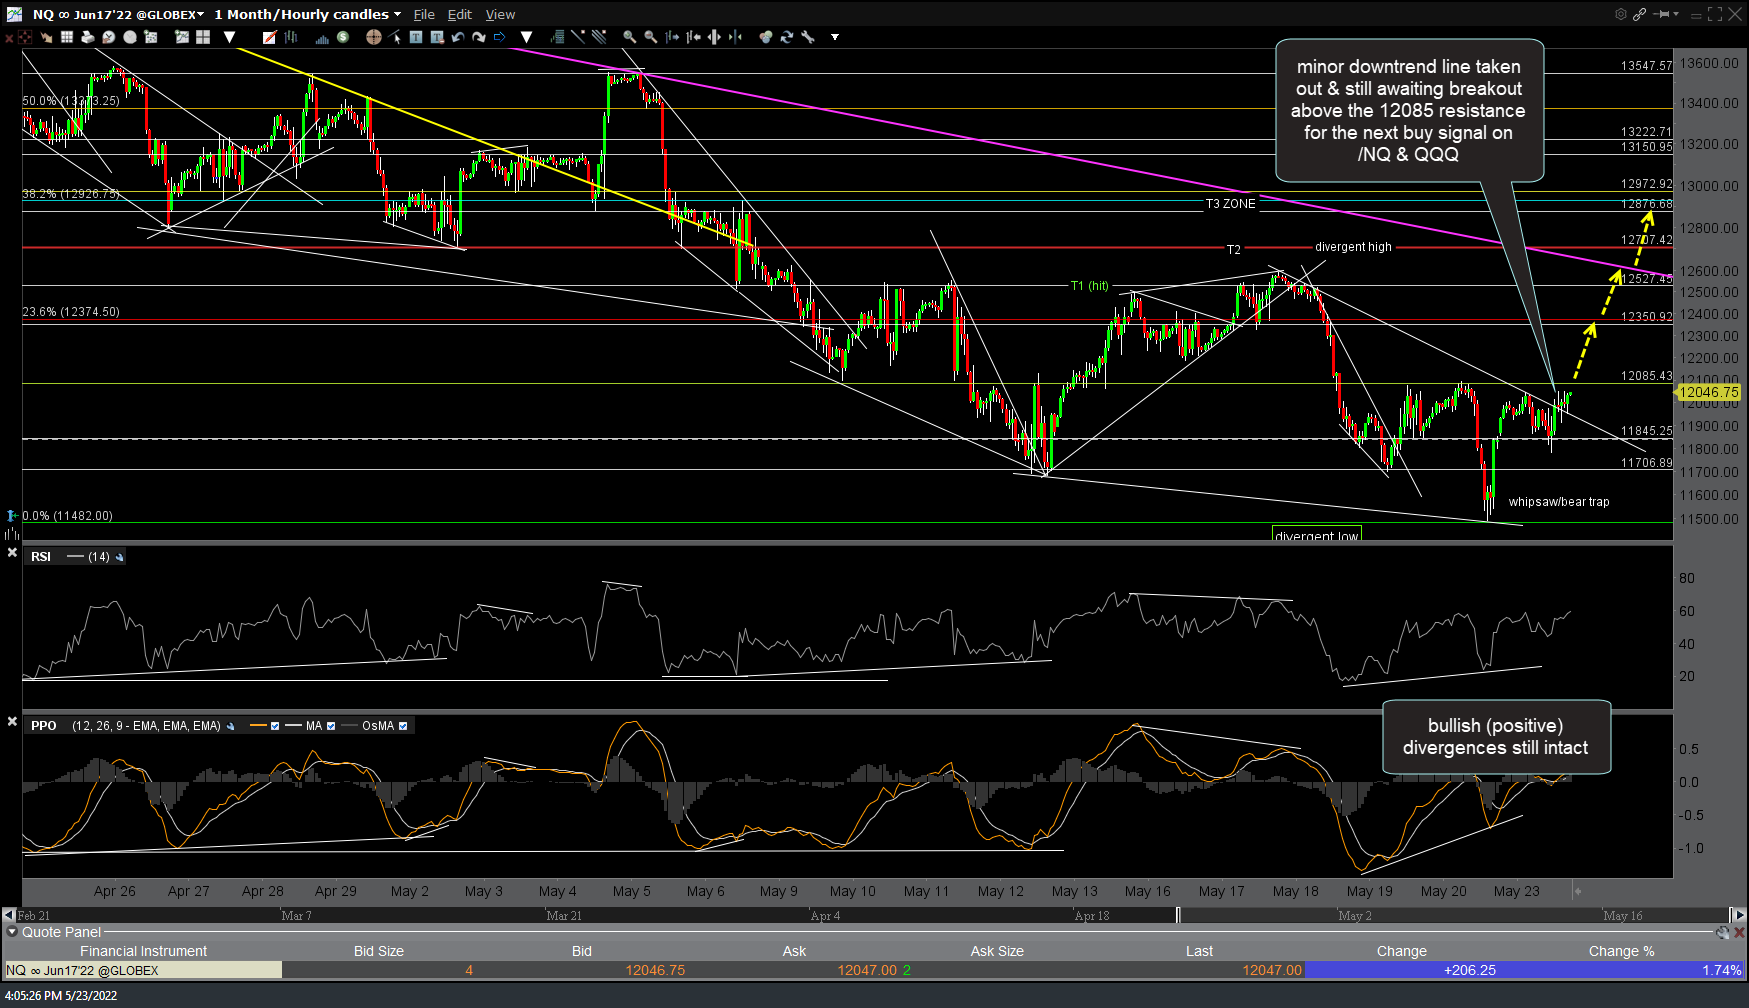
The minor downtrend line was taken out today & I’m still awaiting (and favoring) a breakout above the 12085 resistance for the next buy signal on /NQ & QQQ. 60-minute chart of /NQ (Nasdaq 100 futures) below.
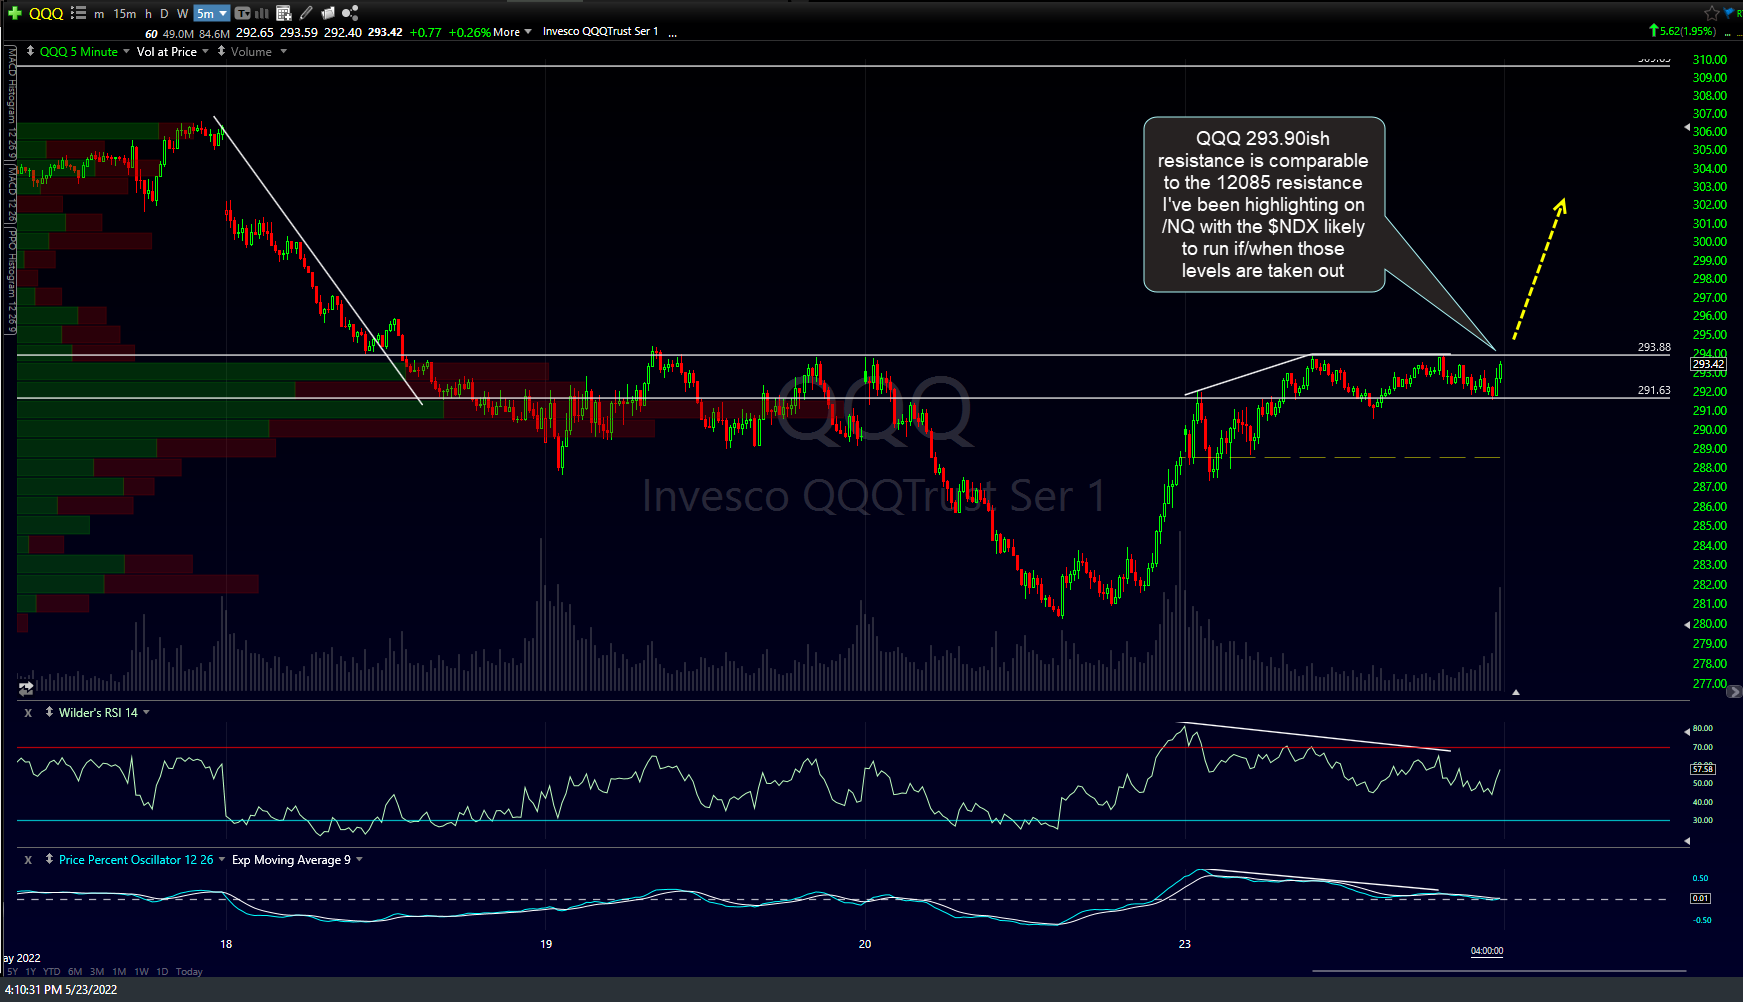
Zooming down to the 5-minute chart of QQQ, the 293.90ish resistance level is comparable to the 12085 resistance I’ve been highlighting on /NQ with the $NDX likely to run if/when those levels are taken out.
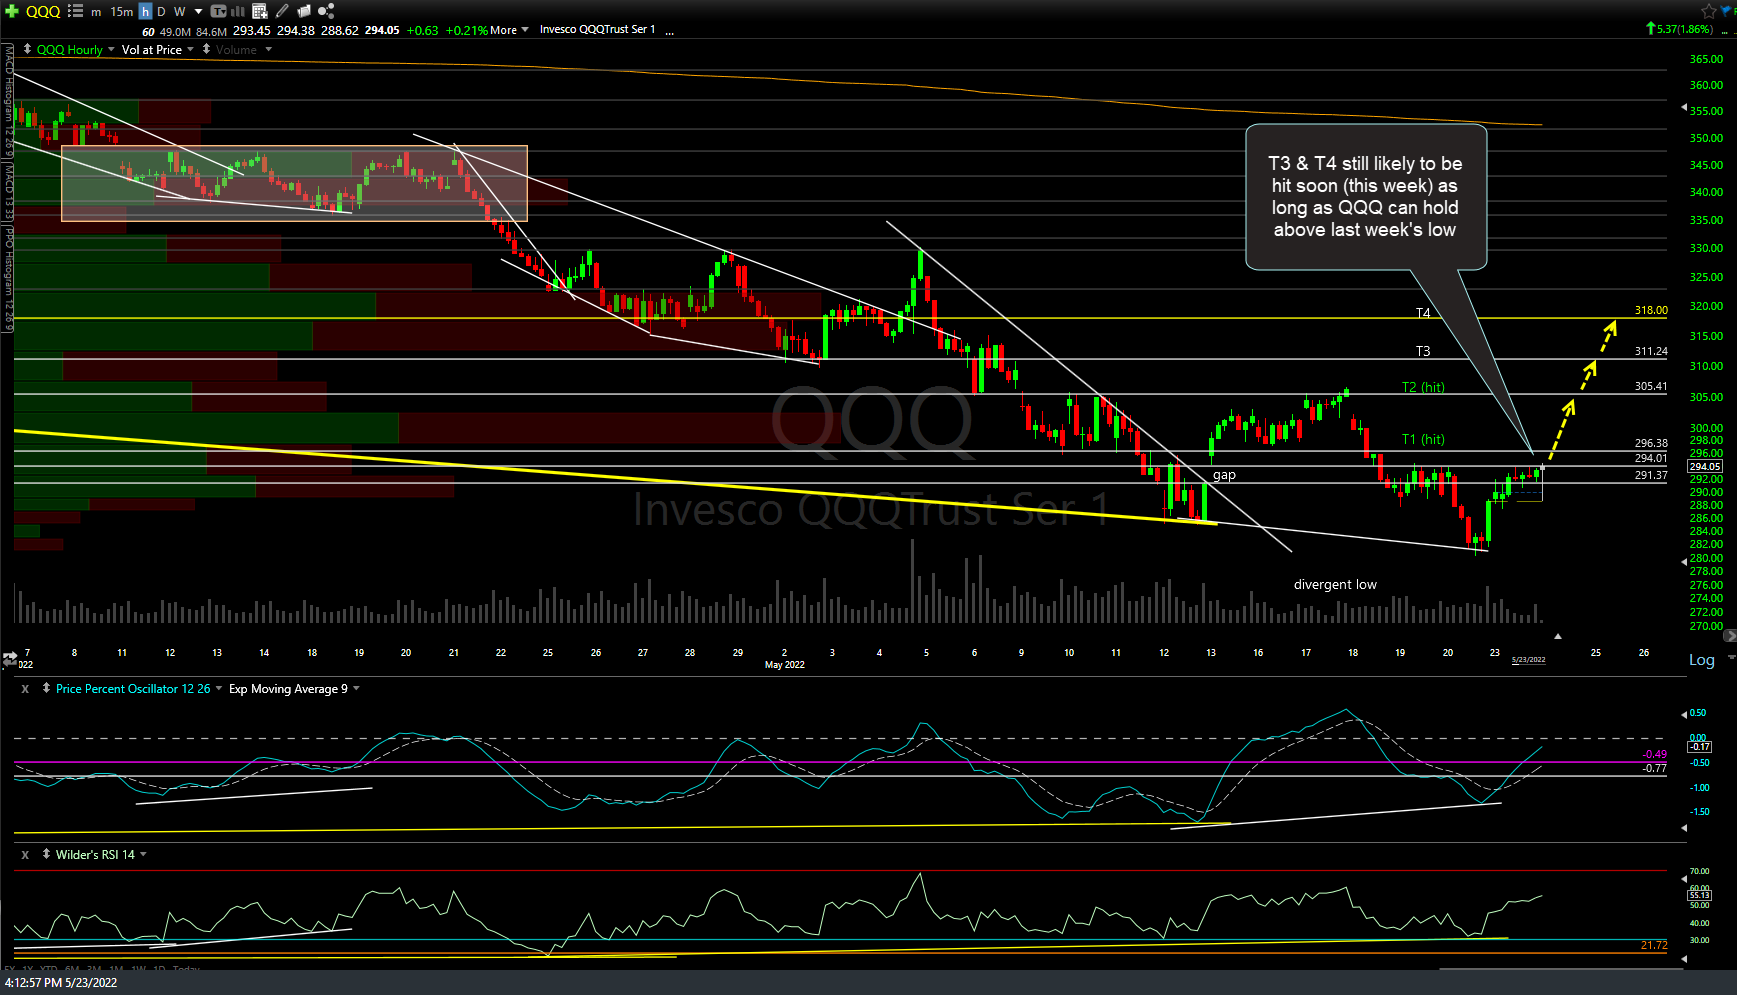
QQQ third & fourth near-term targets (T3 & T4) are still likely to be hit soon (this week) as long as QQQ can hold above last week’s low. 60-minute chart of QQQ below.
The /ES (S&P 500 futures) 3951 resistance level highlighted last night was taken out with the next buy signal to come on a break above the minor downtrend line. 60-minute chart below.
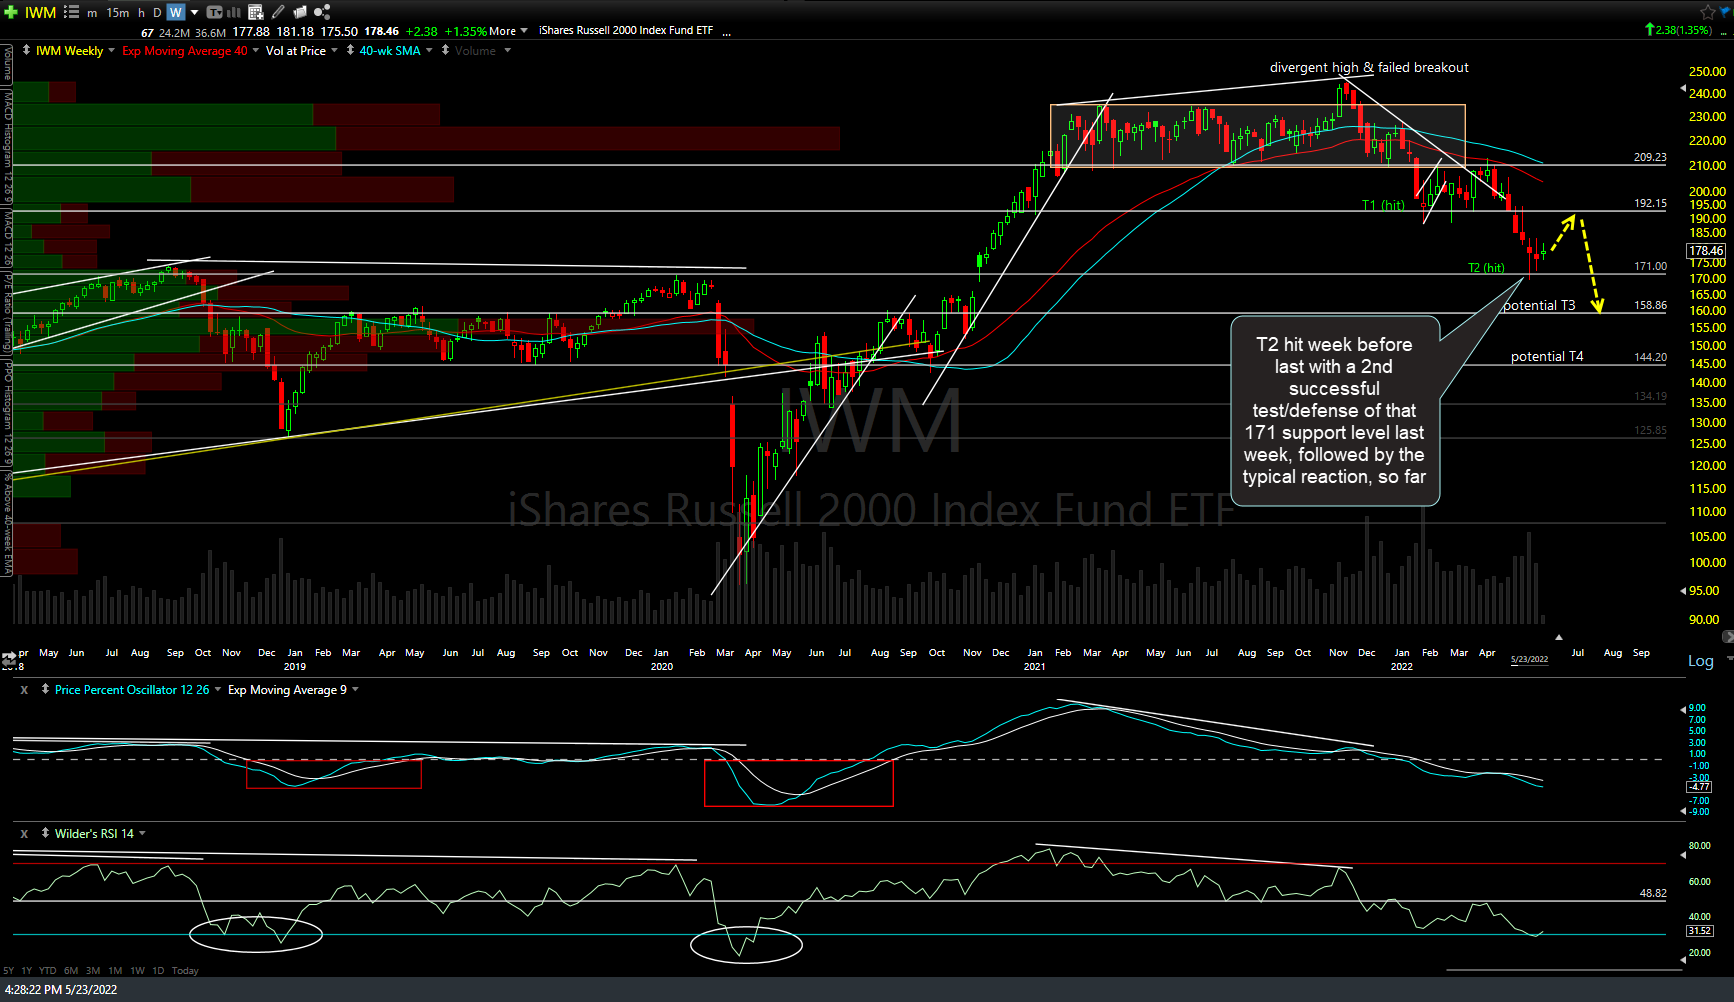
The small-caps still look good for a swing long after IWM hit & successfully tested the T2 (second target, good for a ~19% profit) over the past two weeks with the small-caps trading comfortable above that 171 support so far this week. IWM weekly chart below.
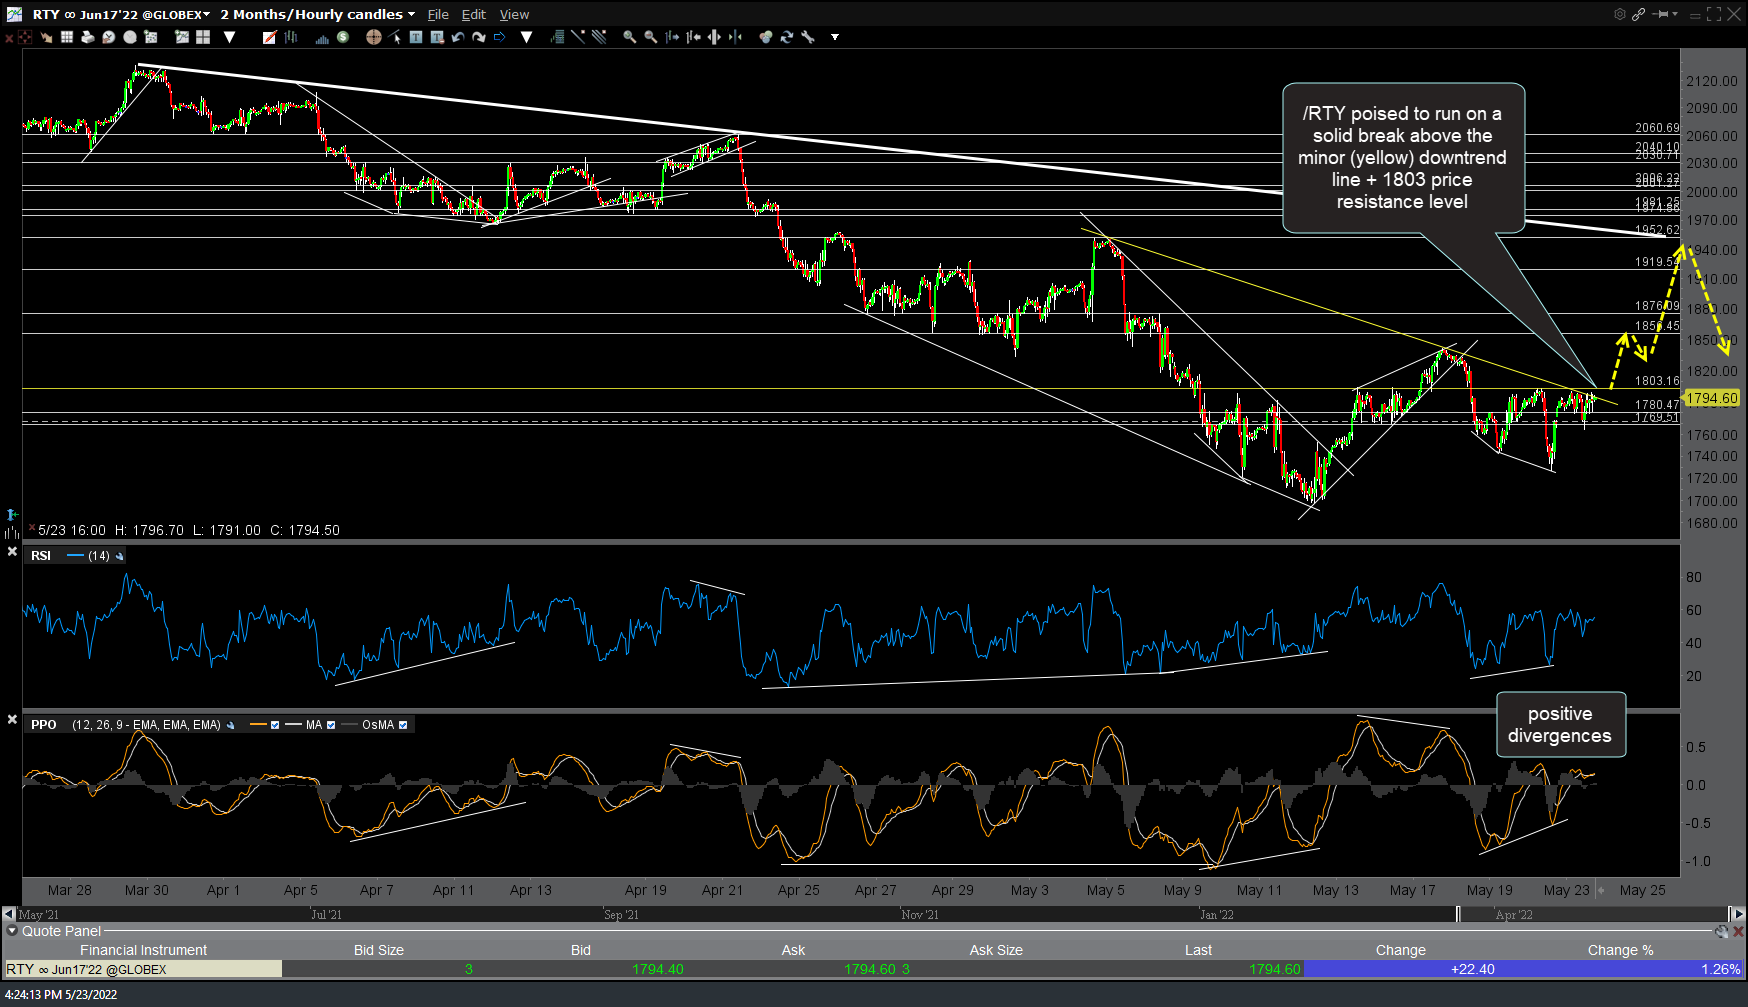
Zooming down to the 60-minute chart of /RTY (Russell 2000 Small-cap futures), /RTY (and IWM) appear poised to run on a solid break above the minor (yellow) downtrend line + 1803 price resistance level.
Bottom line: Staying long for now with plans to add to my index longs on breakouts above the aforementioned resistance levels just above but driving with one foot on the accelerator & the other foot hovering just above the brake pedal, ready to close longs and/or reverse back into short, should the market make another run at last week’s lows.
Only looking for a tradable bear market rally at this time with my current max. bounce targets (subject to revision depending on how the charts develop going forward) of roughly 12-13% above Friday’s lows but again, ready to pivot on a dime, depending on how things unfold from here.


