
The 60-minute chart of /NQ (Nasdaq 100 futures) below highlights the significant technical developments & active trading opportunities starting with yesterday’s sell signal that came earlier in the session with the impulsive breakdown below the primary uptrend line. That sell signal was further validated with the concurrent breakdown below the 60-minute bearish rising wedge pattern in /ES. /NQ then hit & bounced off the first price target at 10508, followed by the formation of a bear flag continuation pattern later in the evening. The next sell signal & objective short entry(ies) came on the breakdown below the bear flag as well as the 10508 support level just below. With about 1½ hours to go before the opening bell today, /NQ is currently offering another objective short entry on this snapback rally to test the 10508 resistance level from below, targeting the next support zone of 10337-10290.
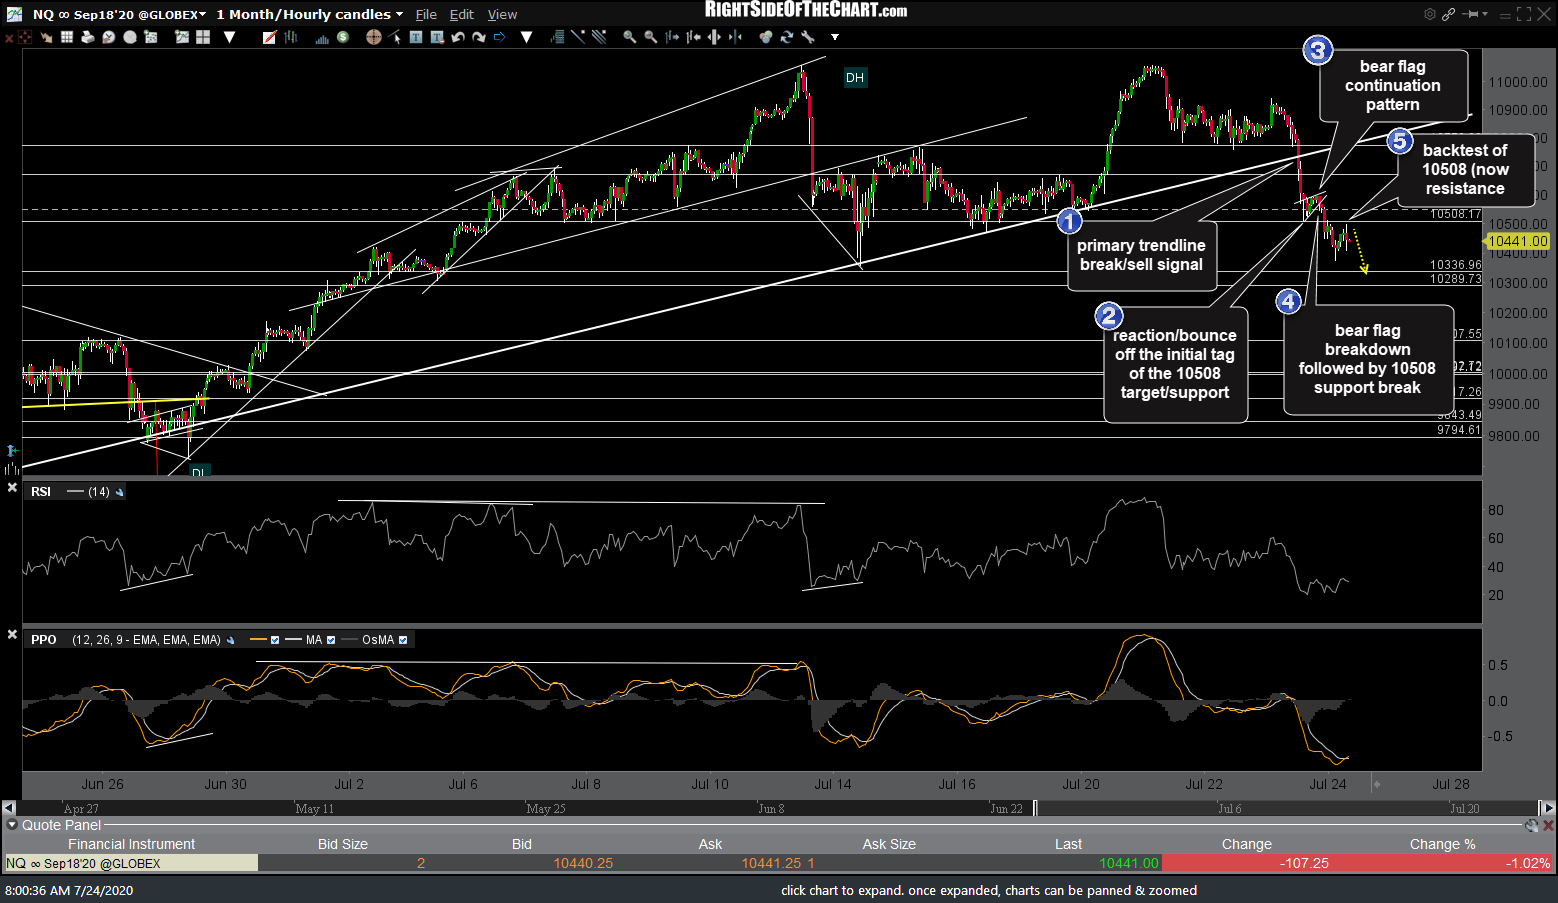
NQ 60m July 24th
Likewise, /ES (S&P 500) is backtesting the 3225.50ish 1st target/support, now resistance level following yesterday’s rising wedge breakdown.
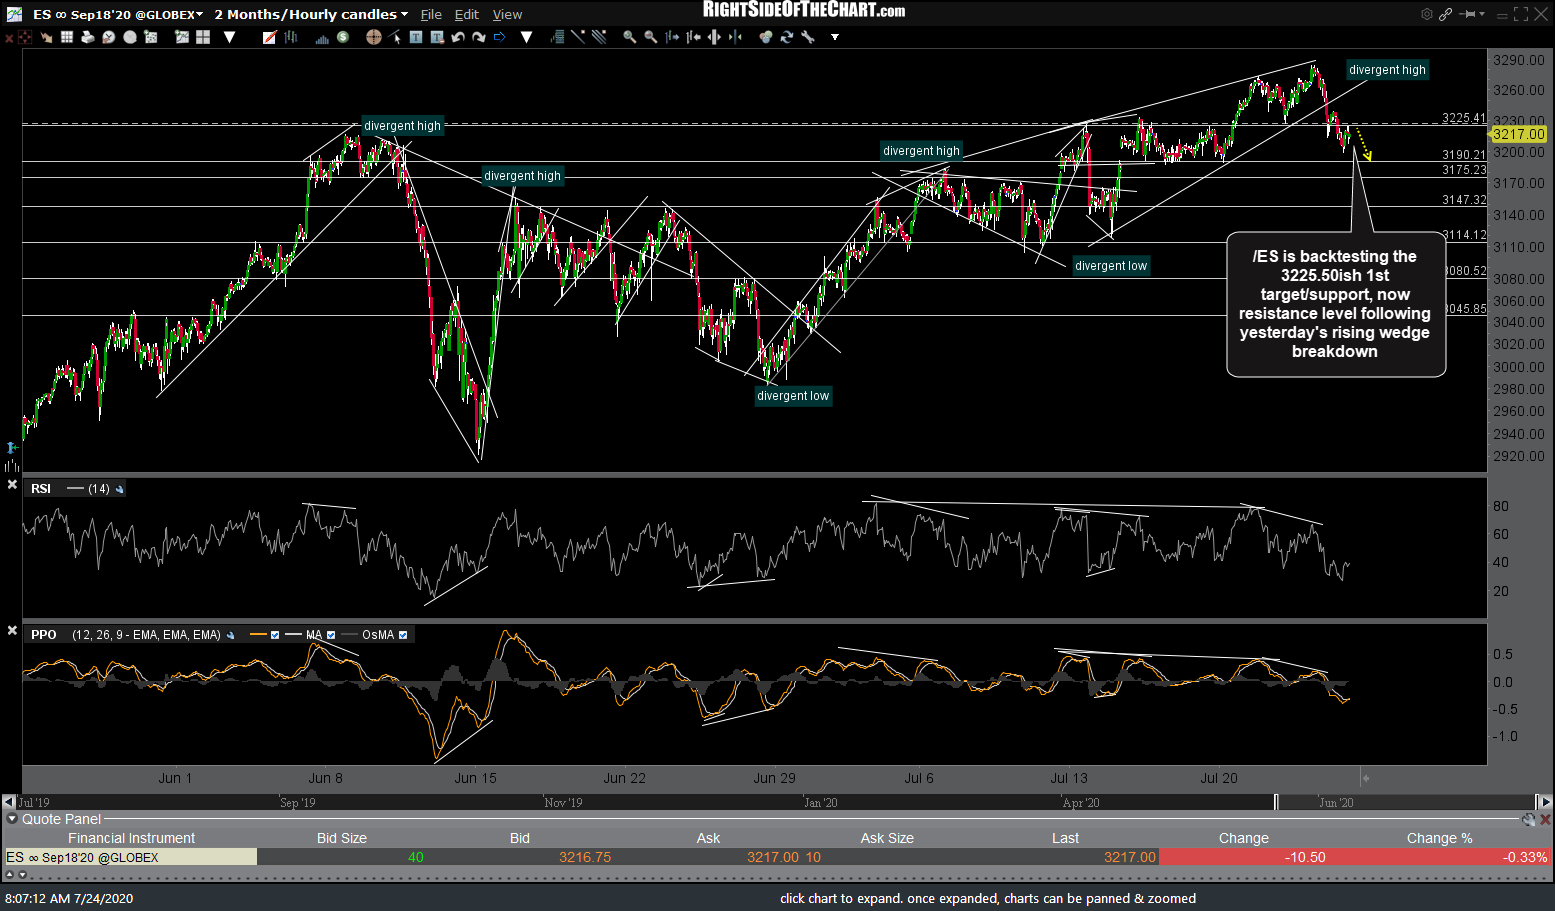
ES 60m July 24th