
This question came from someone new to the site today and although I’ve discussed this in the past, as new followers continually come to the site I believe this bears repeating from time to time. Therefore, let me post the question, followed by my reply below:
Q: On your post of April 17th I believe, re: the SPY trendline that MUST hold…. you don’t give the number. I am watching it right now at 154.28 or so. Can you either tell me where that trendline is today or post it on your site?? It would be a big help if you actually gave numbers when you make a comment like that….especially a trend line that is critical to your analysis.
A: The reason that I did not list a numerical level to watch on the SPY is because trendlines (uptrend or downtrend), unlike horizontal support and resistance levels are dynamic, not static. Due to their positive or negative slope, their values change daily (even more frequently on intraday charts). That is why a trade setup, such as a bullish falling wedge pattern, will not list a specific entry level (because we do not know when prices will break above the falling wedge) but the profit targets, which are typically horizontal resistance levels, are identified in advance of the pattern triggering an entry.
My recommendation is to replicate the patterns or trendlines that your are interested in following on your own charts. All the charts posted on RSOTC.com are saved in a large, high-resolution setting. Once a thumbnail image on the site is clicked to expand (using a PC or laptop), the chart is automatically re-sized to best fit your specific monitor. However, once expanded, the charts can be zoomed in & out in one of several ways if using a desktop computer: Using the scroll-wheel found on top of some mice (which I highly recommend buying if you do not have one) –OR- click & hold the very bottom-right corner of an expanded chart (where the small grey dots are) and drag the chart in or out. Most laptop touch-pads have a zoom feature built in as well. Once the chart is expanded, place your finger along the far right edge of the touch-pad and slide up (to zoom in) or down (zoom out). Once zoomed, you can then click and hold to pan the image and move it around in order to center the area(s) of the chart that you want to view up close.
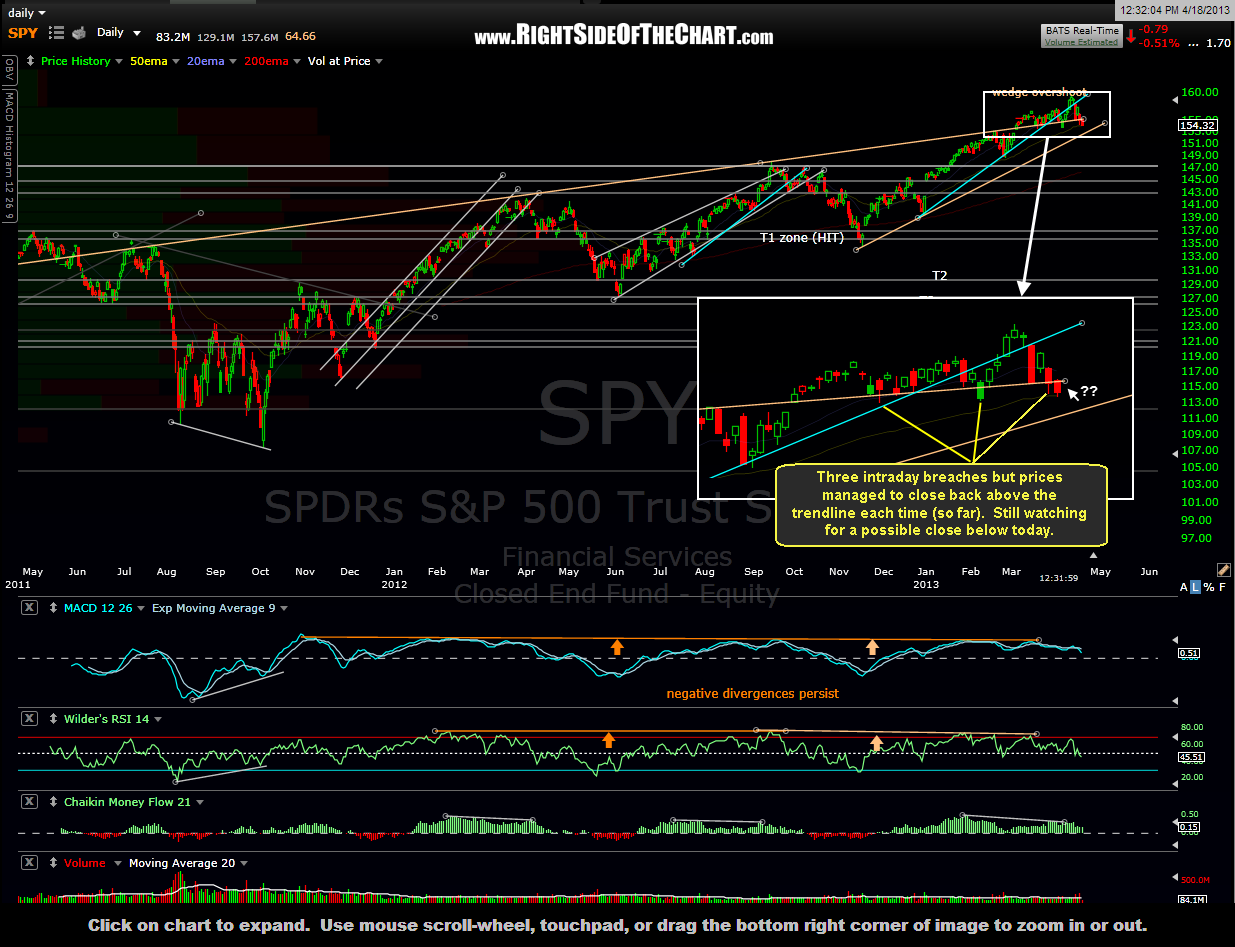 As far as that trendline that I highlighted on the SPY (it was April 16th), here’s the updated daily chart with an overlay of a zoom in to the area in question. As you can see when looking closely, that trendline has produced numerous reactions with multiple candlestick bodies or shadows on touching that level. Although I still think the selling might begin to accelerate once/if we print a solid intraday break or close below that trendline, there is an additional uptrend line (orange) that comes into play not too far below. However, my current take is that any reaction off that level will be relatively minor in scope and duration and a such, I do not plan to adjust my positioning if/when we get there (as of now… since my opinion/trading plan will change/adjust as the technicals do).