
I had to run an errand to & just returned to my desk to find a somewhat surprisingly strong rally in the market. I haven’t had a chance to scour the headlines but at quick glance, all I see are abysmal earnings from the world’s largest bank, JPM, with profits tumbling 69% and another TBTF bank, WFC, with earnings plunging 98%. I must be missing something so I’ll post another update after I’ve caught up on the charts & any headlines that might account for a 2.35% broad-based rally in the S&P 500 & more importantly, what I must be missing that would account for the Nasdaq 100 rallying 3% to come within 12% of its all-time high from Feb 19th.
I understand that generally speaking, tech companies tend to carry lower levels of debt & are less impacted by the social distancing & stay at home orders but the last time I checked, the Nasdaq 100 & tech stocks, in general, have always fallen in lock-step, if not more, than the broad market during recessions as their business model is every bit, if not more, sensitive to consumer spending & the business cycle as the most of the sectors & stocks within the S&P 500.
We could be looking at a buying climax although it’s too early to say just yet. As of now, SPY is testing the key 282.16 resistance level while still well below both the key 200-day exponential & simple moving averages with nearly all of my trend indicators, from long-term to short-term, still bearish.
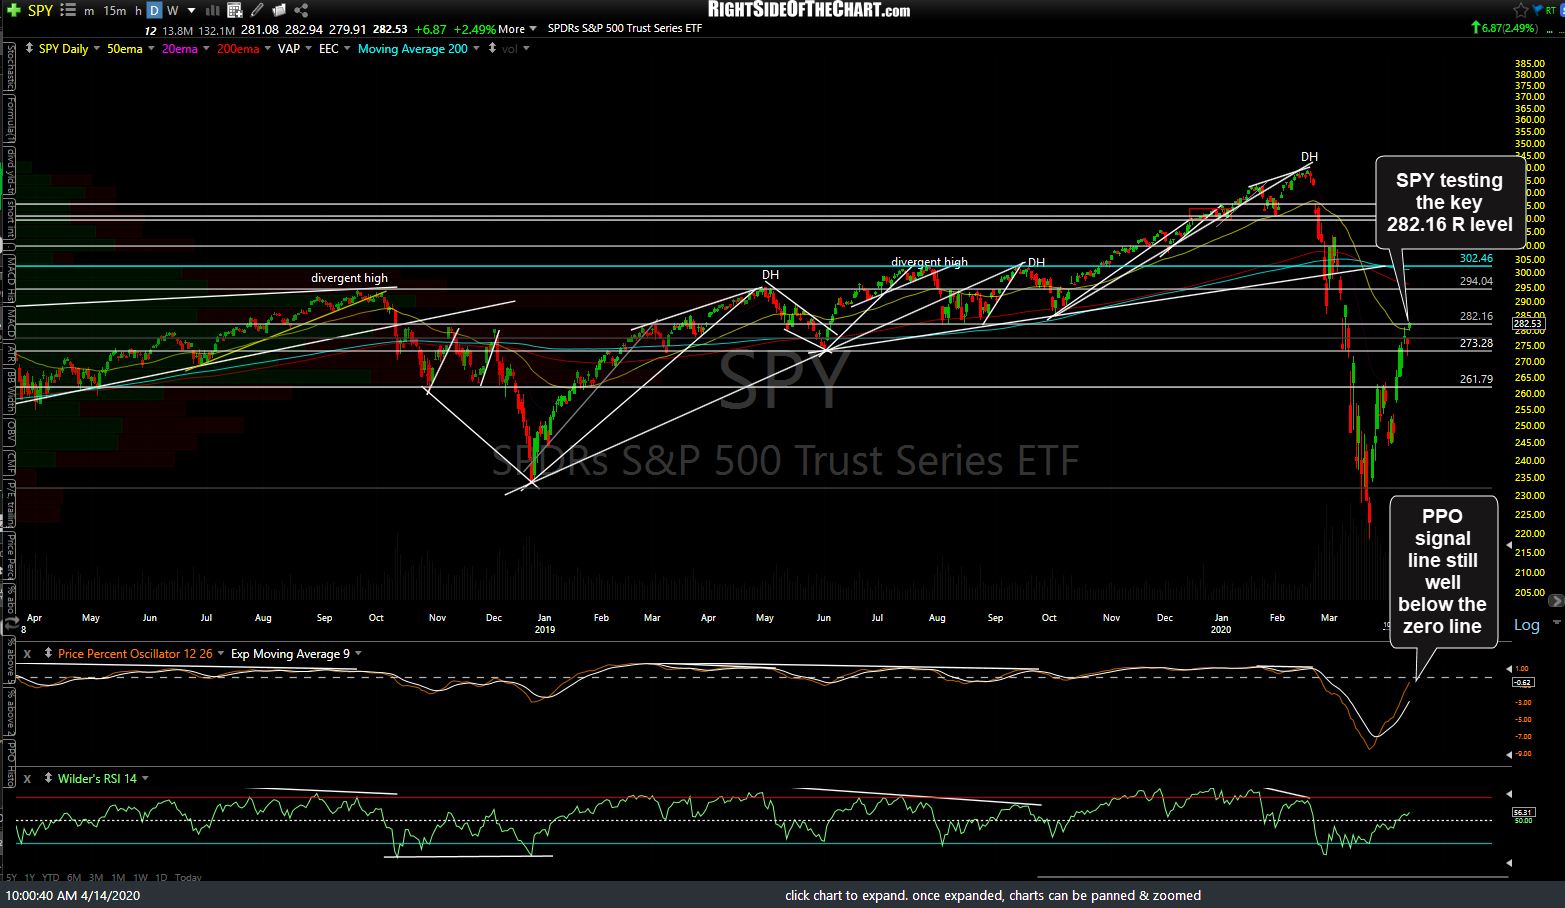
SPY daily April 14th
The tech-heavy QQQ has regained the cluster of key moving averages (200-day EMA, SMA + the 50-day EMA) and is currently testing the 61.8% Fibonacci retracement level.
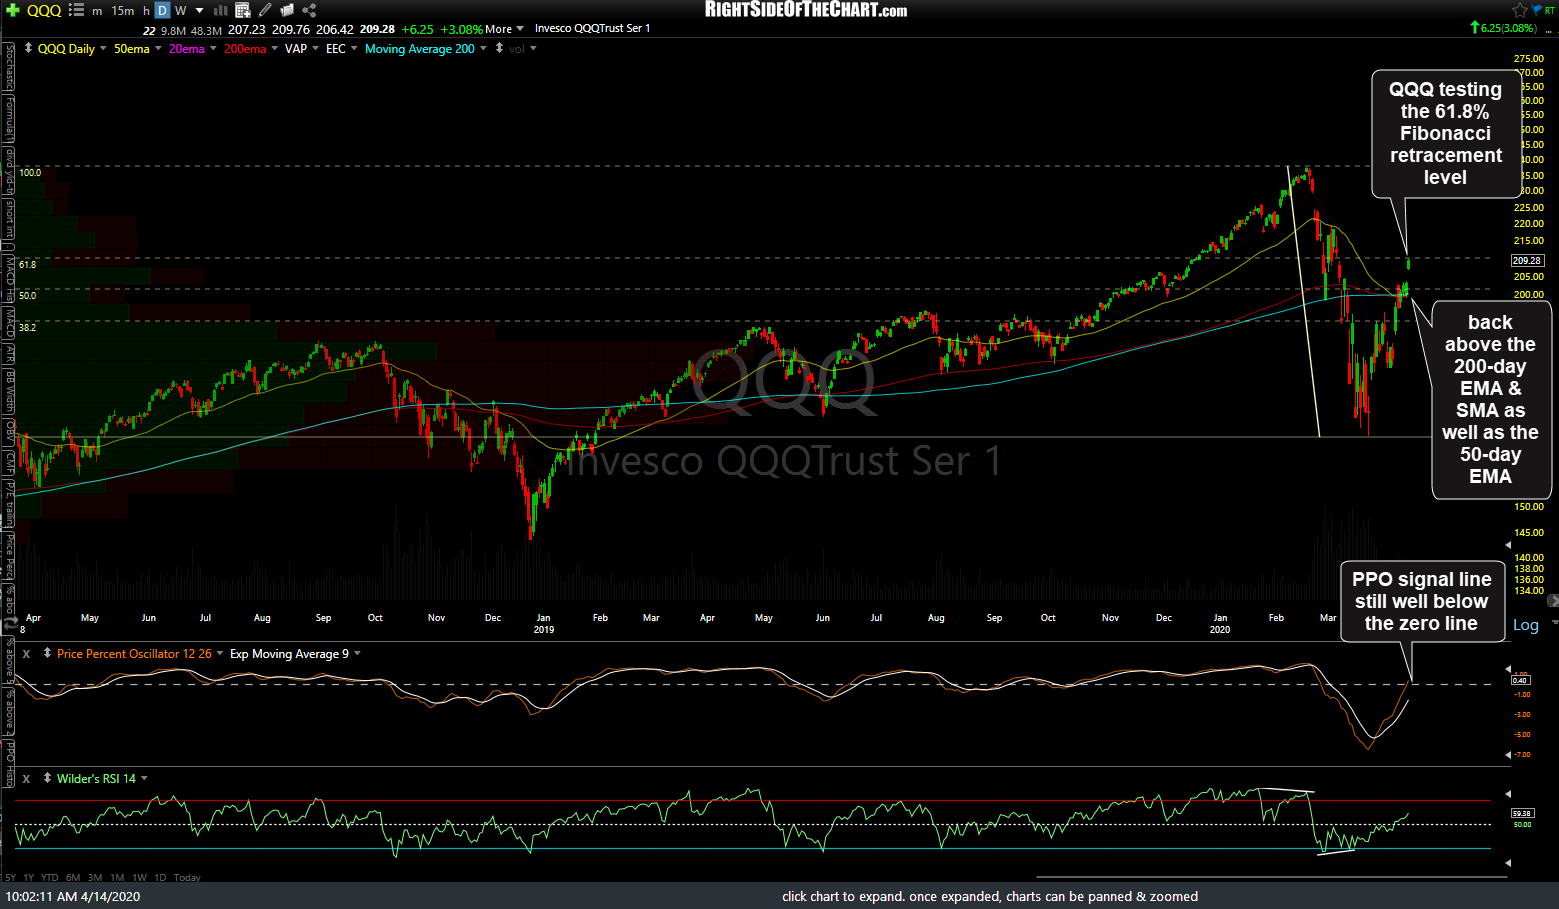
QQQ daily April 14th
Why might that be significant, you might ask? Great question: The first major bear market rally in the 2007-2009 bear market was capped at the 61.8% Fibonacci retracement level, followed by another 51% drop from there. Not to mention that the first minor bear market (~9% rally in Nov/Dec 2017) was also stopped cold at the 61.8% Fib retracement level. The first minor bear market rally during this bear market (Feb/March), was capped around the 50% Fib & was good for a 10.8% bounce. This first major bear market rally at the 61.8% Fib has accounted for a 27% gain so far with that first major bear market rally from late March to early June 2008 posting a gain of just over 23%, which meshes with my “Super-Size” bull market/bear market theory (the bigger the preceding bull, the bigger the corrections within that bull as well as the waves within the subsequent bear market).
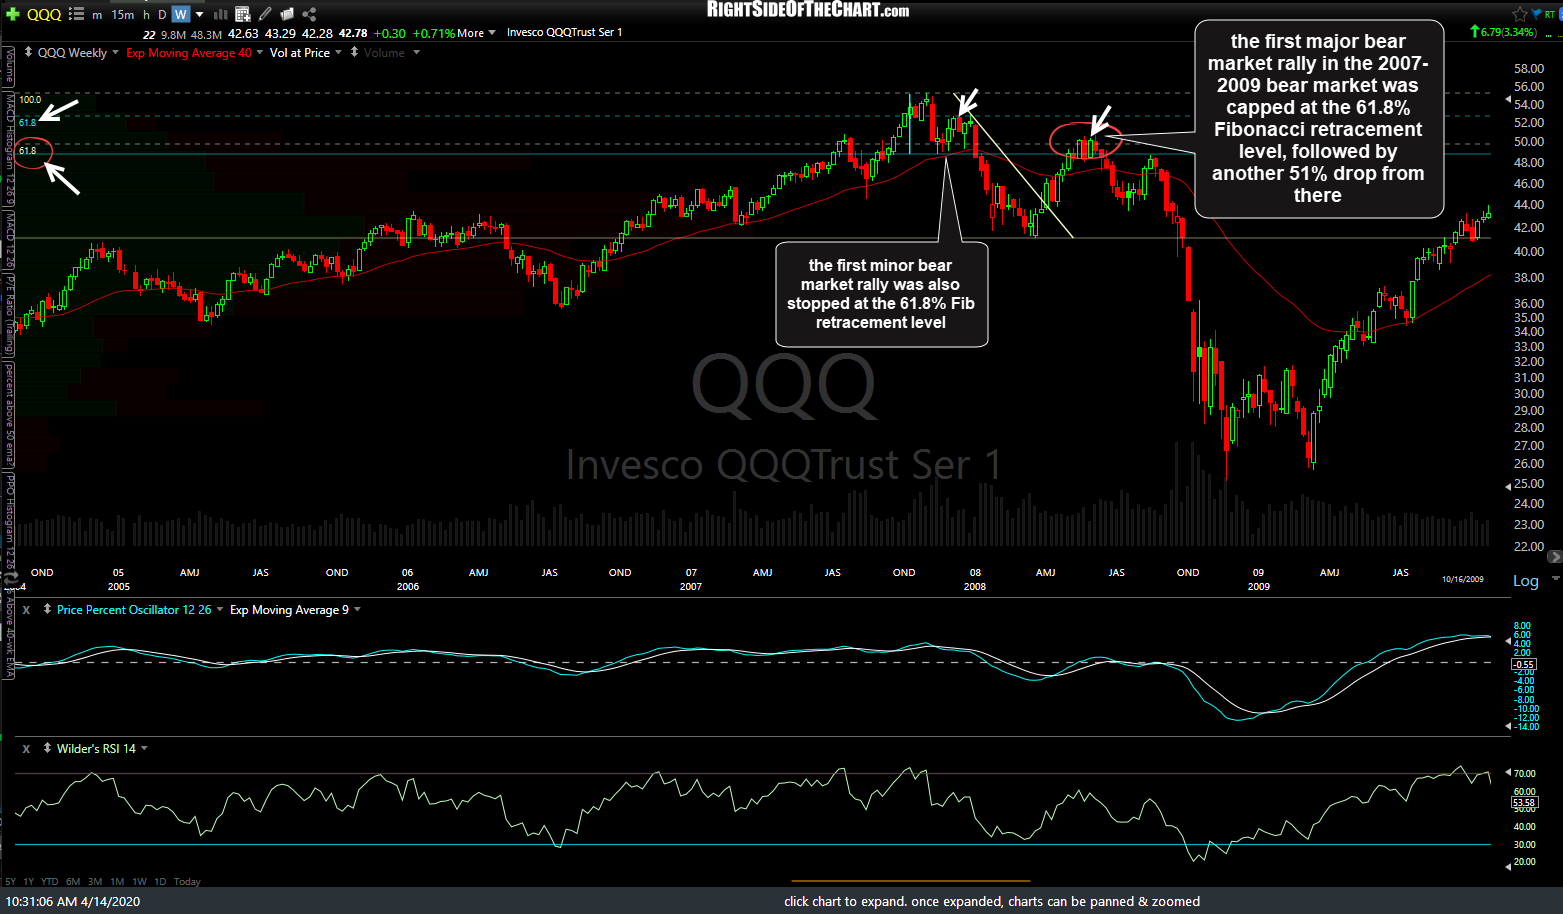
QQQ 2008 bear market rallies
Okay, but comparing the end-points of current first minor & major bear market rallies to the first minor & major bear market rallies of the previous bear market could just be chalked up to coincidence, right? Maybe, however, the first major bear market rally in QQQ during the 2000-2002 bear market was also capped at the 61.8% Fibonacci retracement level, twice, with QQQ plunging another 81% from there. History doesn’t always repeat… but it often rhymes.
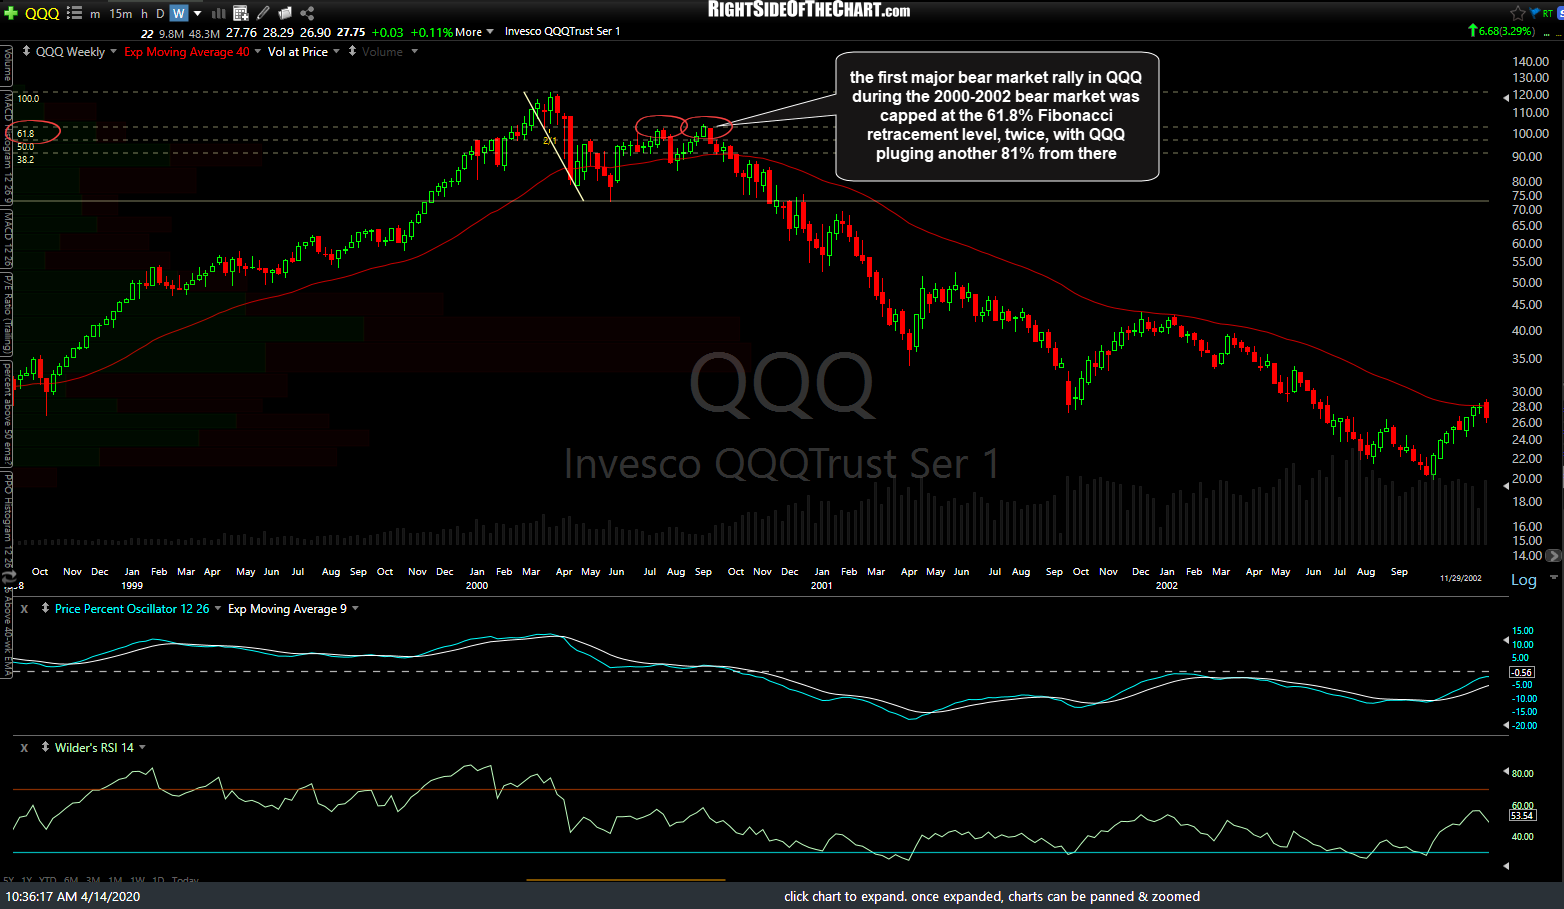
QQQ 2000 bear market rallies