Member @raider74 asked for my thoughts on SPY within the trading room. As I haven’t posted analysis on the broad market in a while, mainly due to the fact that there just haven’t been any technically significant developments worth noting, I figured that I’d share my analysis here on the front page.
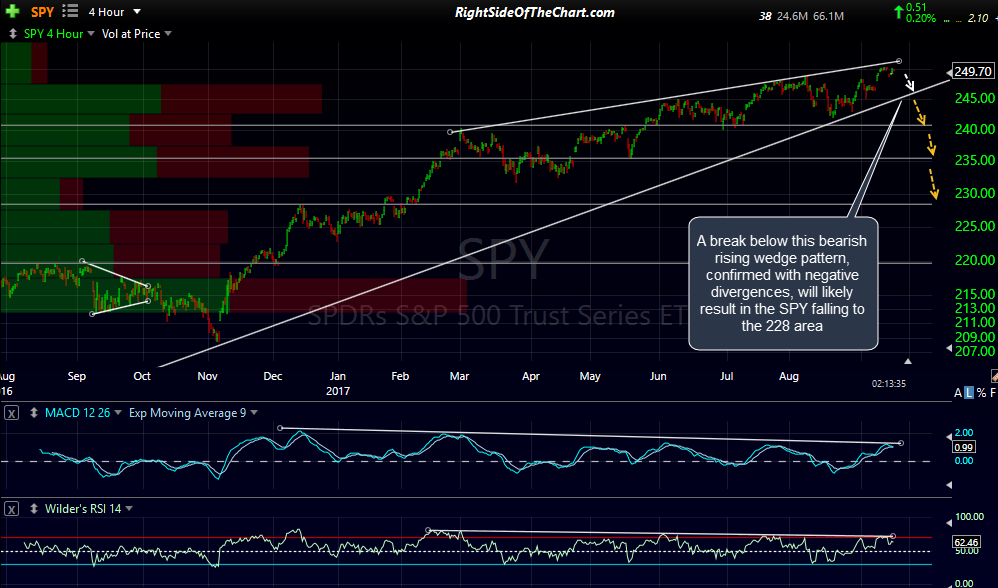
SPY has been slowly creeping its way up this large bearish rising wedge pattern, shown below on a 4-hour period chart (each candlestick represents 4-hours of trading). The bearish nature of that rising wedge is confirmed with negative divergences on the indicators below, which indicates that the momentum of the current rally is diminishing with the chances of a trend reversal (correction) increases as long as those divergences remain intact. A break below this bearish rising wedge pattern, confirmed with negative divergences, will likely result in the SPY falling to the 228 area.
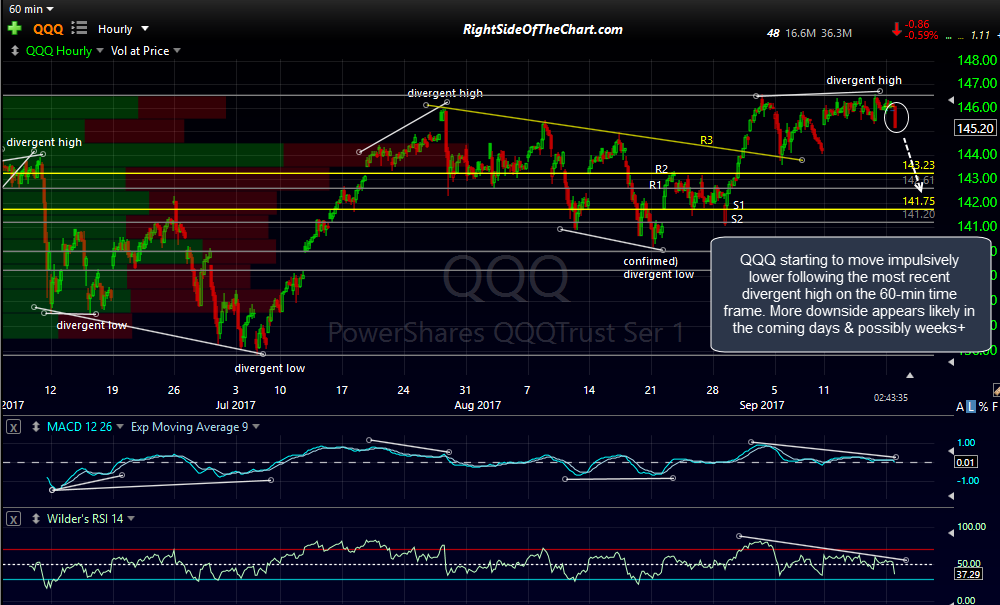
It also appears that there is a good chance that the market leading Nasdaq 100 (via QQQ) may have just topped after several failed attempts to clear the 146.50ish area. QQQ is starting to move impulsively lower following the most recent divergent high on the 60-min time frame. More downside appears likely in the coming days & possibly weeks+.


