
SPY continues to test the 309.57-310.65 resistance level with a solid breakout above that level likely to spark a run up towards the 317.77-320.50 potential target zone although resistance is resistance until & unless taken out so a failure to do so soon will likely trigger a pullback. 60-minute chart below.
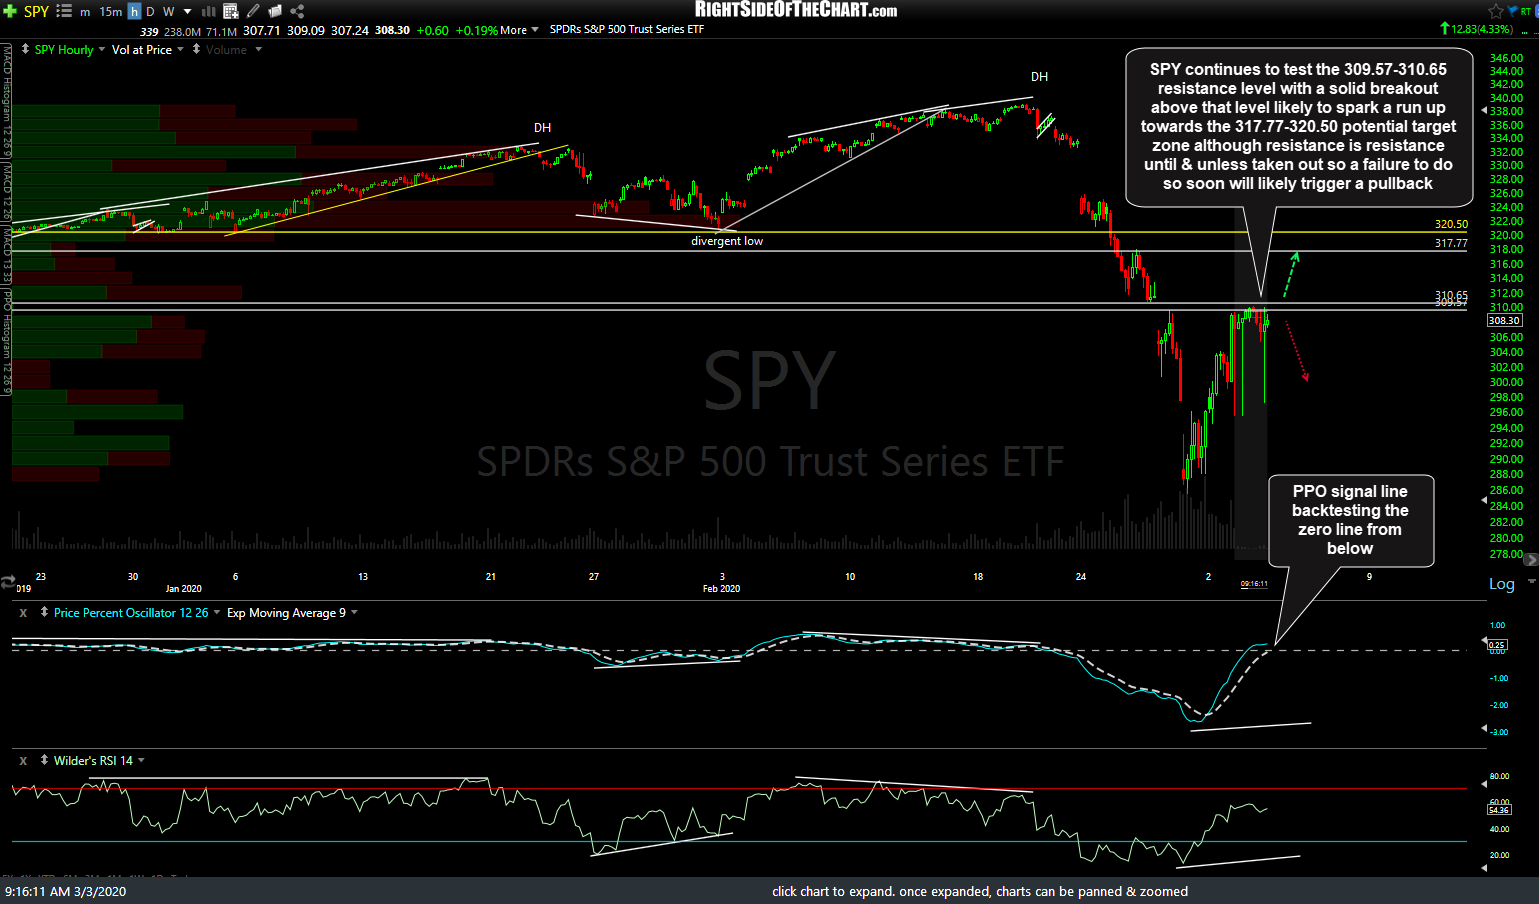
SPY 60m March 3rd
QQQ also continues to test the 217.34 resistance level with a solid breakout above that level likely to spark a run up towards the 220.25 & possibly the 224.18 potential targets although resistance is resistance until & unless taken out so a failure to do so soon will likely trigger a pullback.
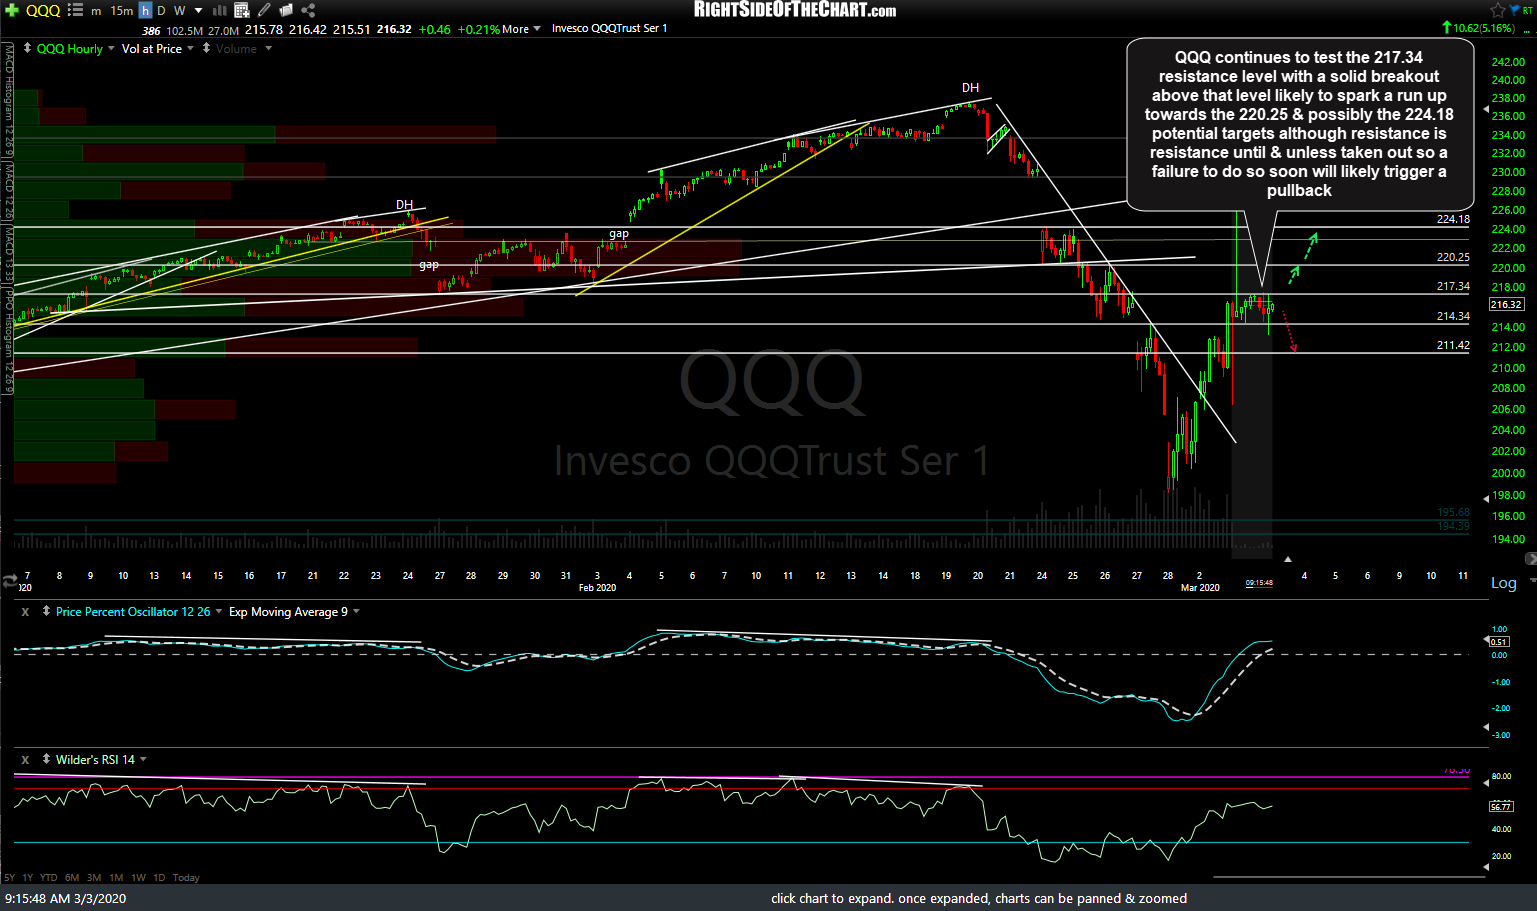
QQQ 60m March 3rd
/NQ (Nasdaq 100 futures) continues to test the bottom of the 8890-8946 R zone since first hitting it around the end of the regular session yesterday. A failure to break above this R level will likely soon spark a pullback to at least the uptrend line + 8700ish support. Also, note the small negative divergence now in place on the indicators.
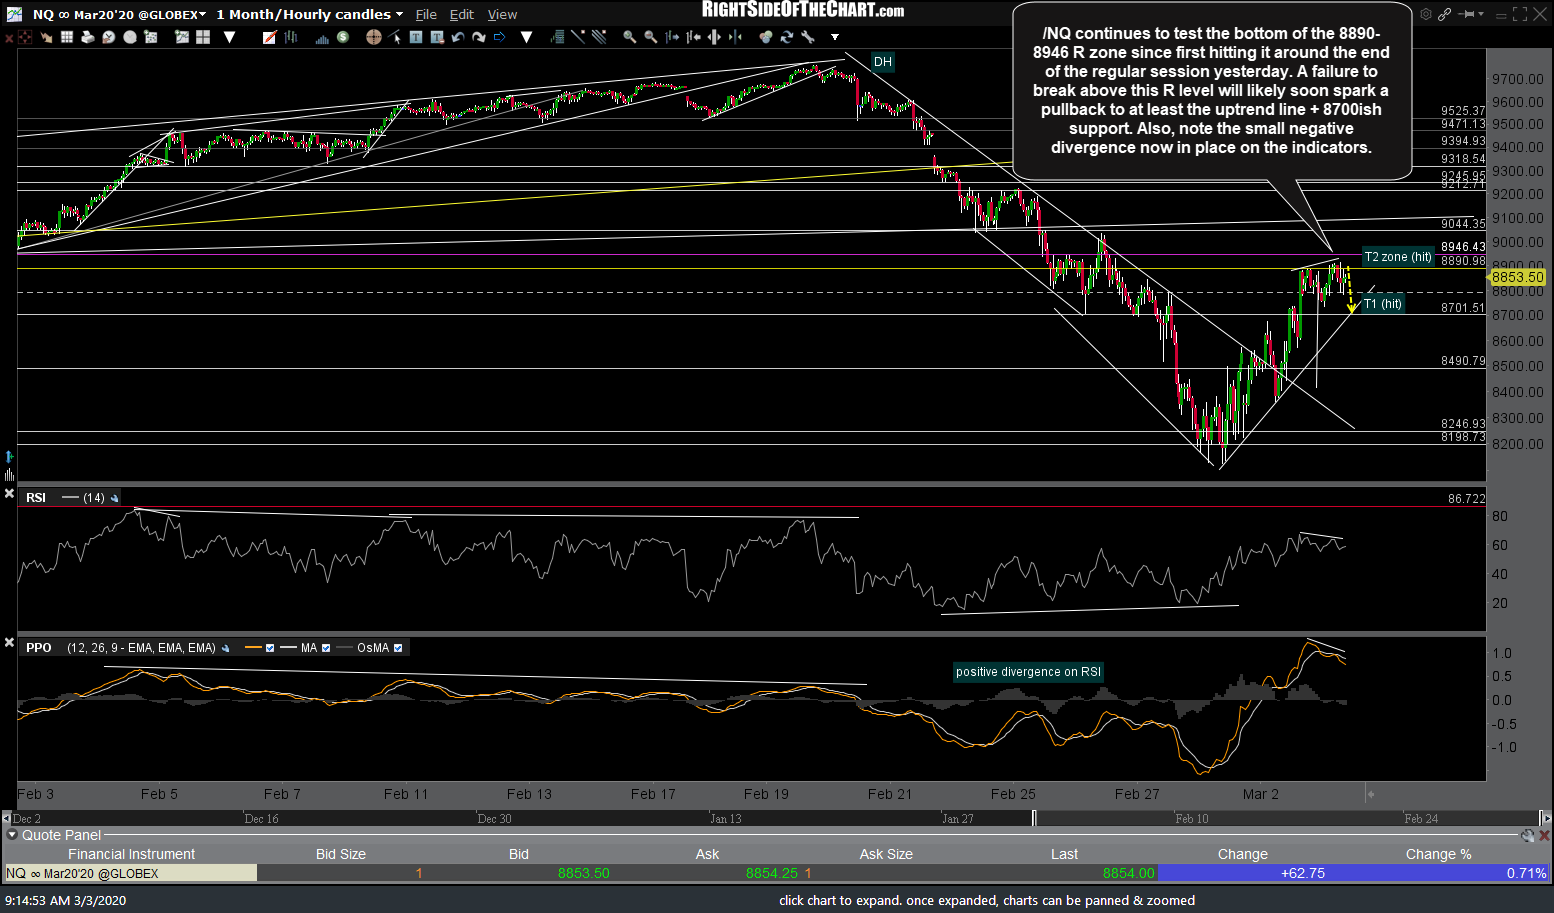
NQ 60m 2 March 3rd
FWIW, I’m leaning toward the scenario of a near-term pullback off these resistance levels, down towards that 8700 + uptrend line support on /NQ, followed by a reversal & rally from there although a solid break of those intersecting support levels would likely open the door to a deeper correction.