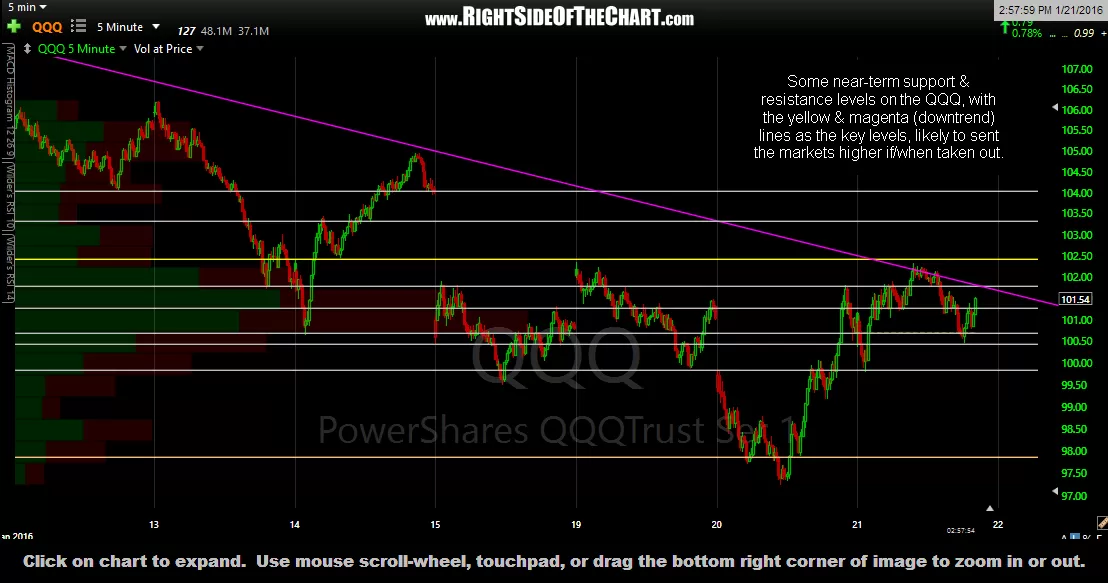
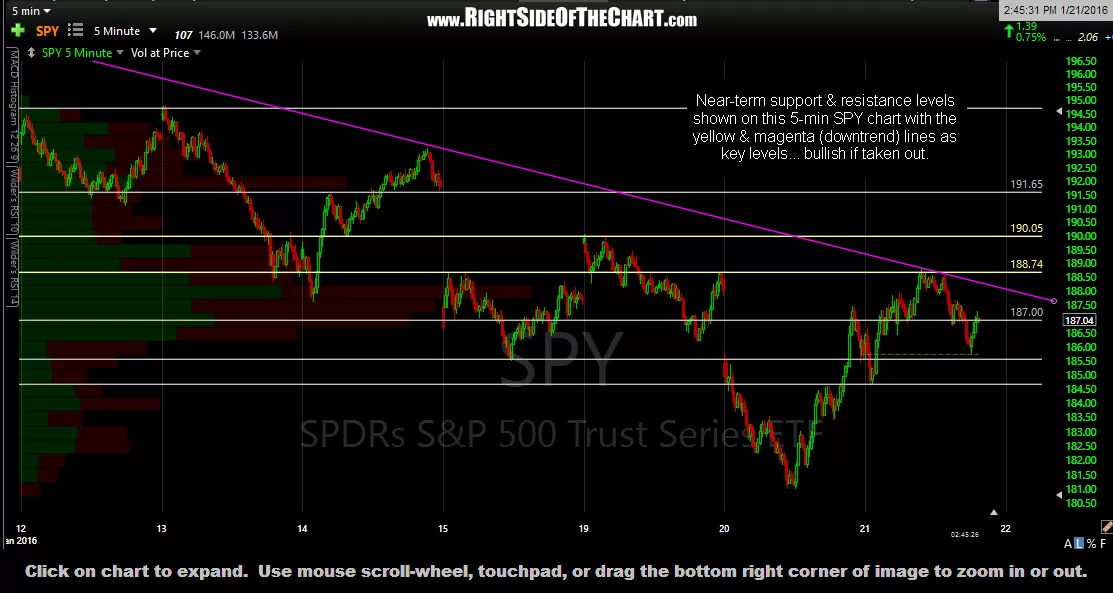
Here are some of the key near-term support & resistance levels shown on these 5-min & 15-minute SPY & QQQ charts with the yellow & magenta (downtrend) lines as key levels, with more upside quite likely if those levels are taken out. So far today the markets have floundered around after testing these downtrend lines from below, which is perfectly normal behavior as they digest the gains from the near vertical ~5% rally off yesterday’s lows. As long as the SPY holds above the 184.70 area & the QQQ above 99.80ish & especially below 99.00, my near-term outlook for US equities remains bullish.
-
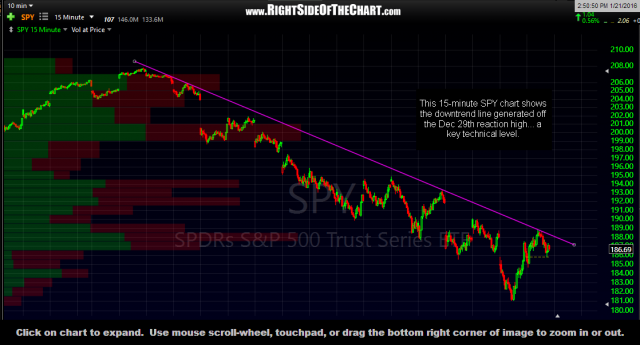
- SPY 15-minute Jan 21st

-
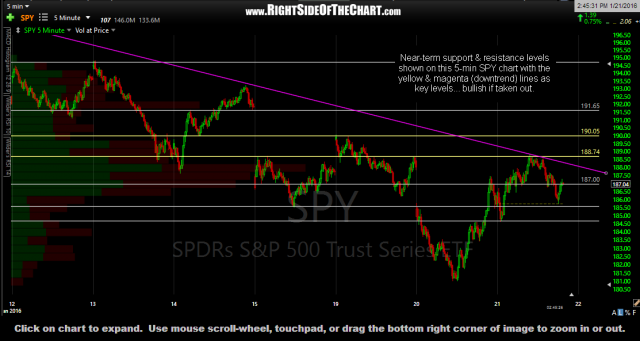
- SPY 5-minute Jan 21st
-
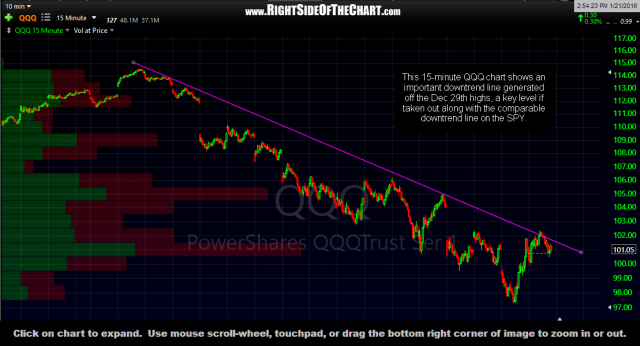
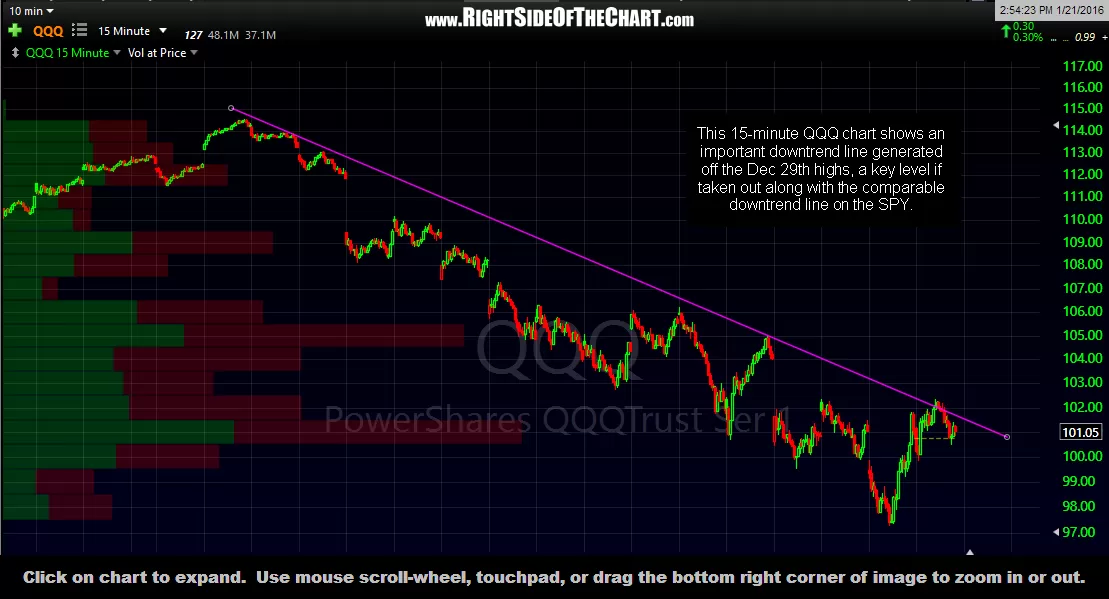
- QQQ 15-minute Jan 21st
-
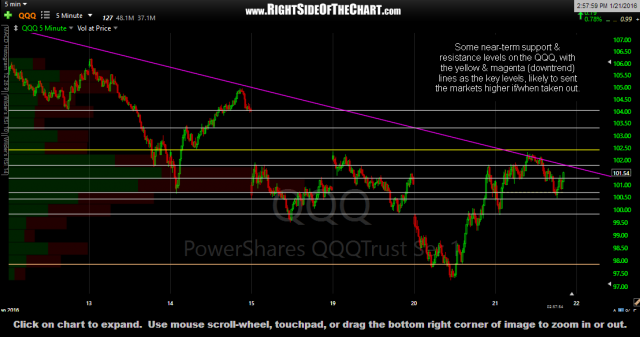
- QQQ 5-minute Jan 21st