
With the broad market on track to finish the day with one of the lowest trading volumes of the year, that keeps the recently highlighted 10-day volume EMA at my ‘pre-correction’ levels which were recently highlighted.
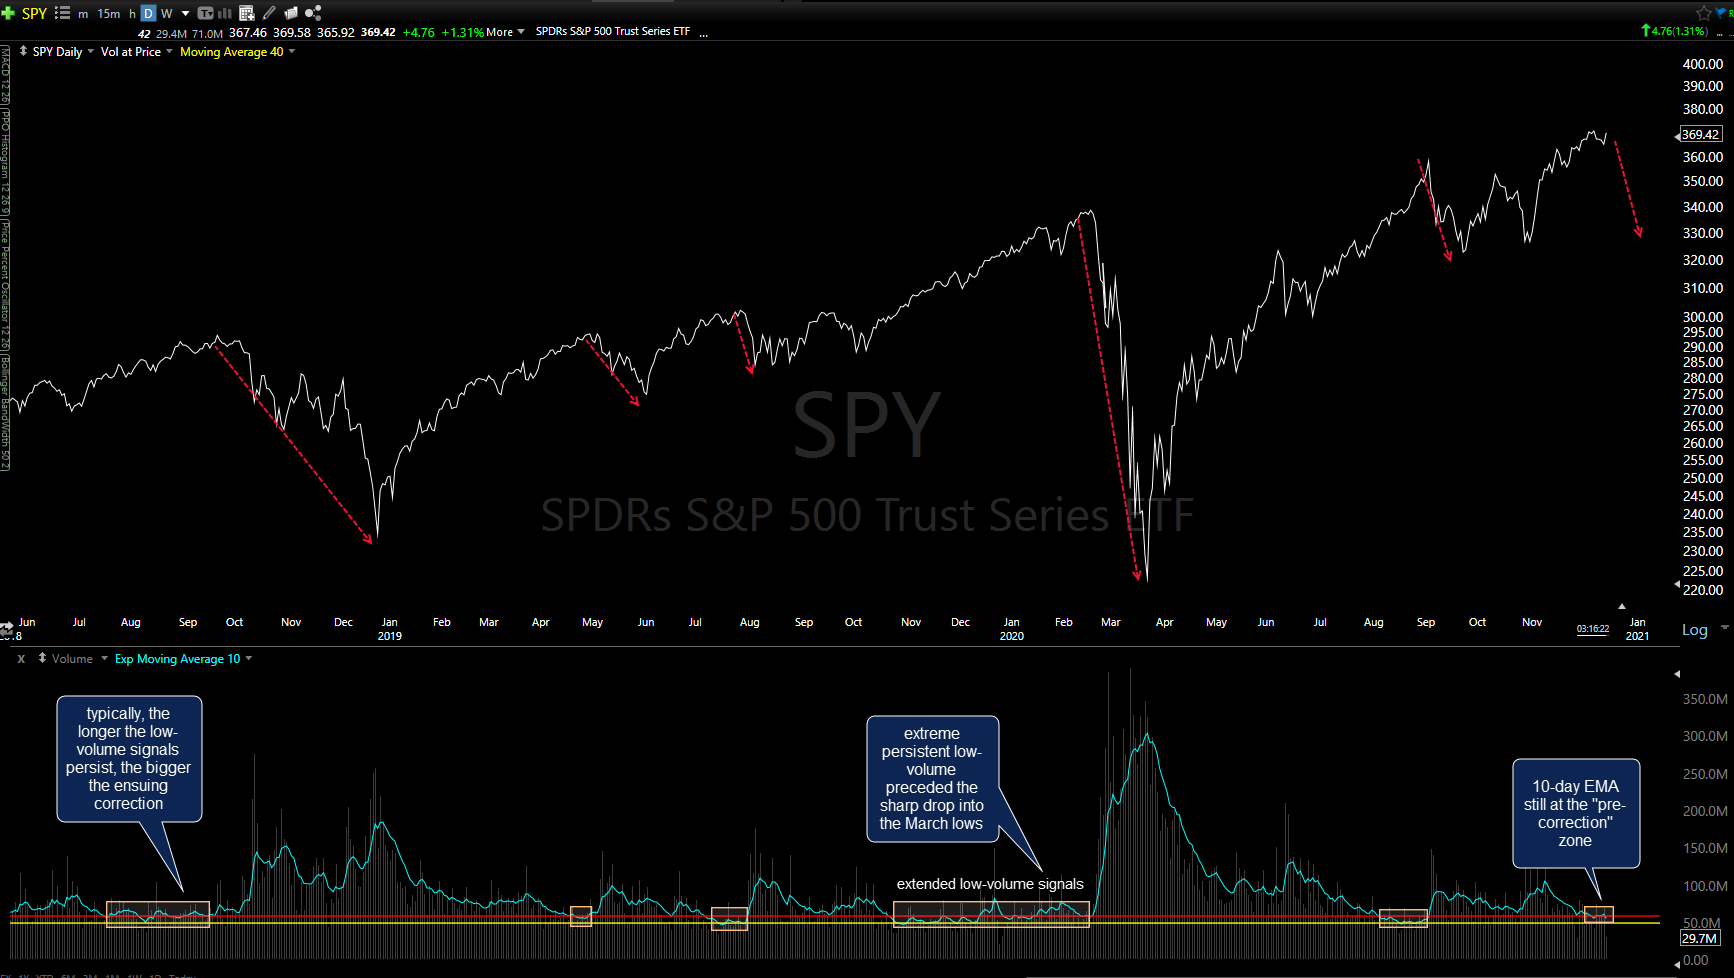
SPY low-volume sell signals Dec 15th
Remember, these are not timing indicators, as drops to the red and/or yellow levels in recent years have been followed by corrections anywhere from a few days to over 3-months since the volume 10-day EMA fell to that pre-correction range. However, most corrections came within a few weeks of the first signal & the longer the signal persists, such as the persistent readings that preceded the 36% plunge into the March lows earlier this year, typically the larger the ensuing correction.
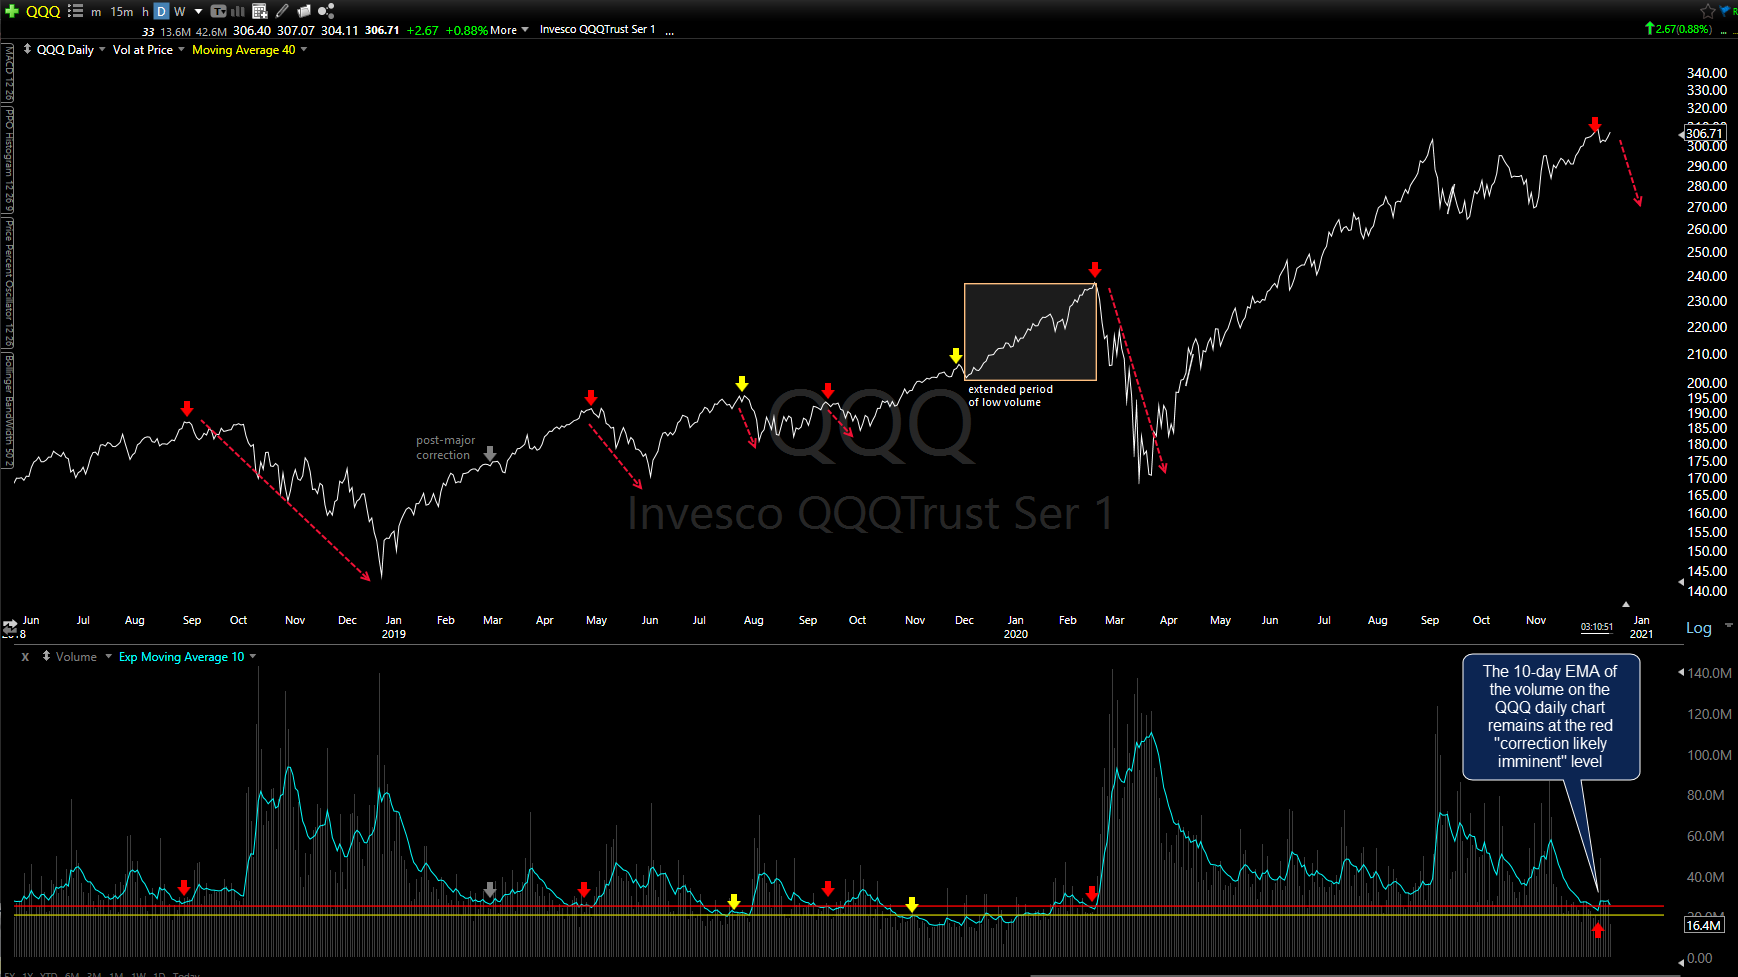
QQQ low-volume sell signals Dec 15th
As drops to those low-volume extremes are not timing indicators, they are most effectively used in conjunction with other more timely sell signals. While the breakdowns/sell signals triggered on Wednesday (Dec 9th) are still intact, we need to see Friday’s lows in SPY & QQQ taken out to increase the odds of a more substantial drop. The 60-minute chart of /NQ (Nasdaq 100 futures) has been updated with some new support/potential target levels as the levels have changed with /NQ rolling to the March contract since my previous charts using the December contract.
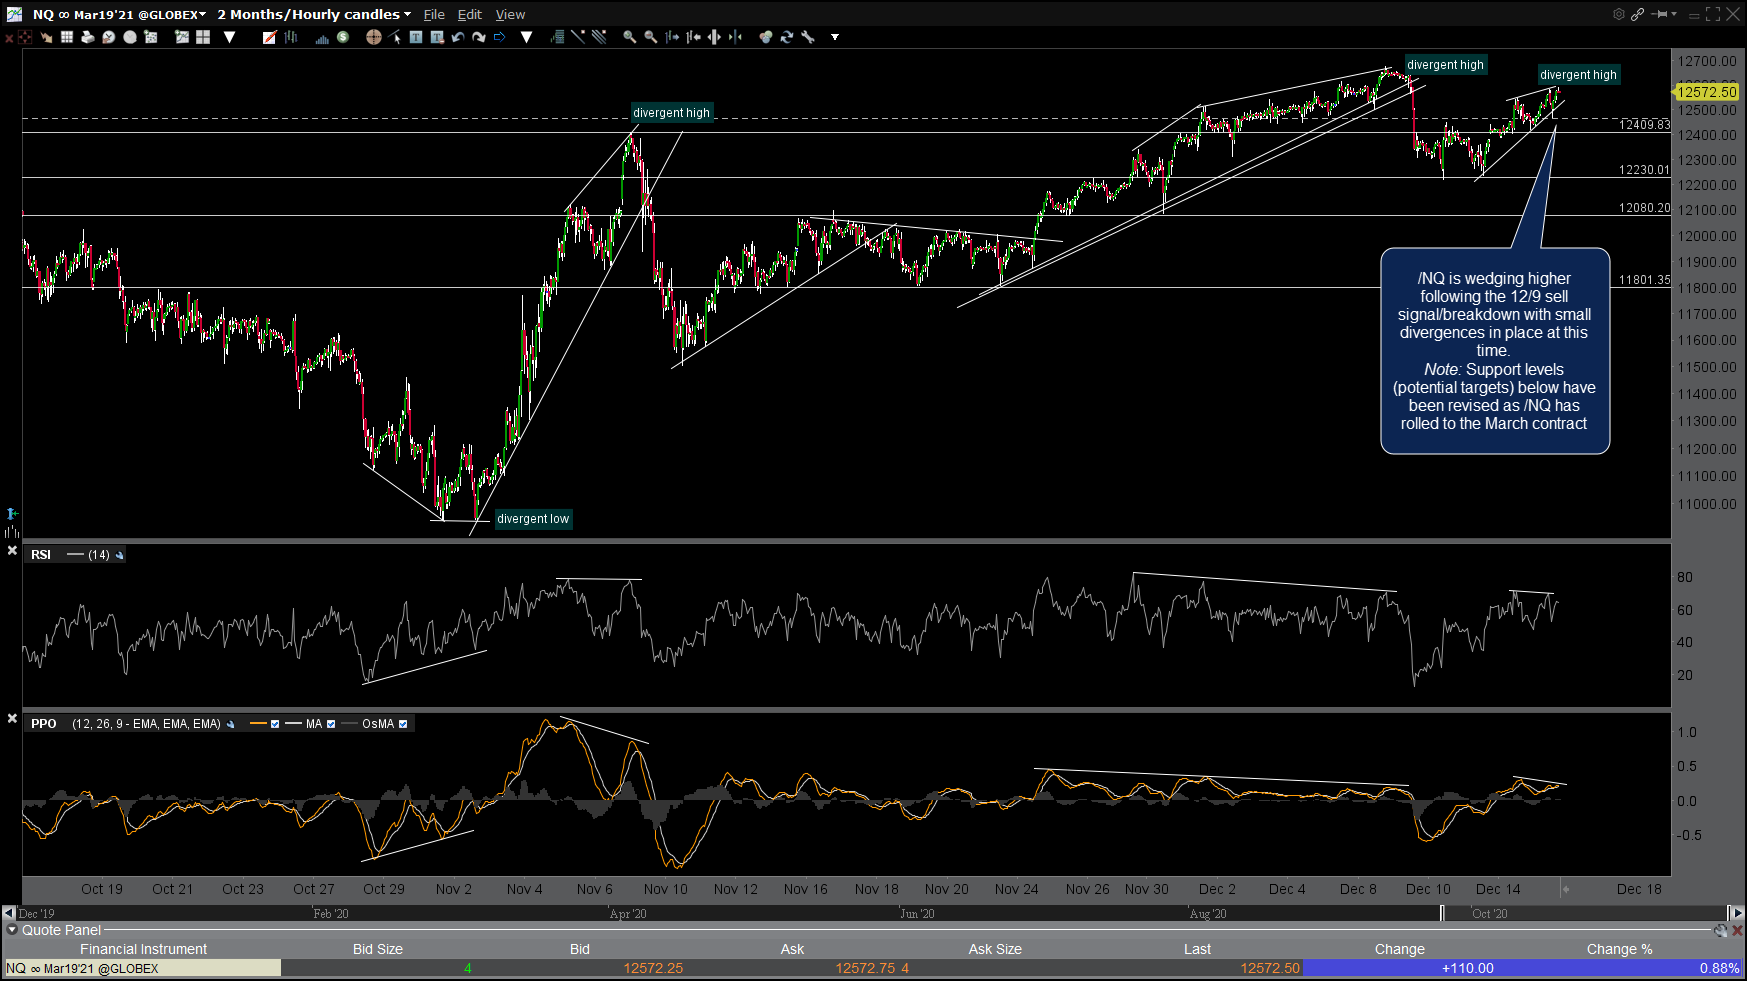
NQ 60m Dec 15th
With the holidays coming up & many traders taking time off, we could very well continue to drift higher on low volume into the new year. As such, it would be prudent to wait for the next sell signals before getting too aggressive with short trades.