Here’s a quick look at the 60-minute charts of the major US stock index-tracking ETFs. So far today, SPY kissed & reversed off the first support level from the 60-minute chart posted before the open today in the Charts I’m Watching Today, with the 280.53 former support now as resistance overhead.
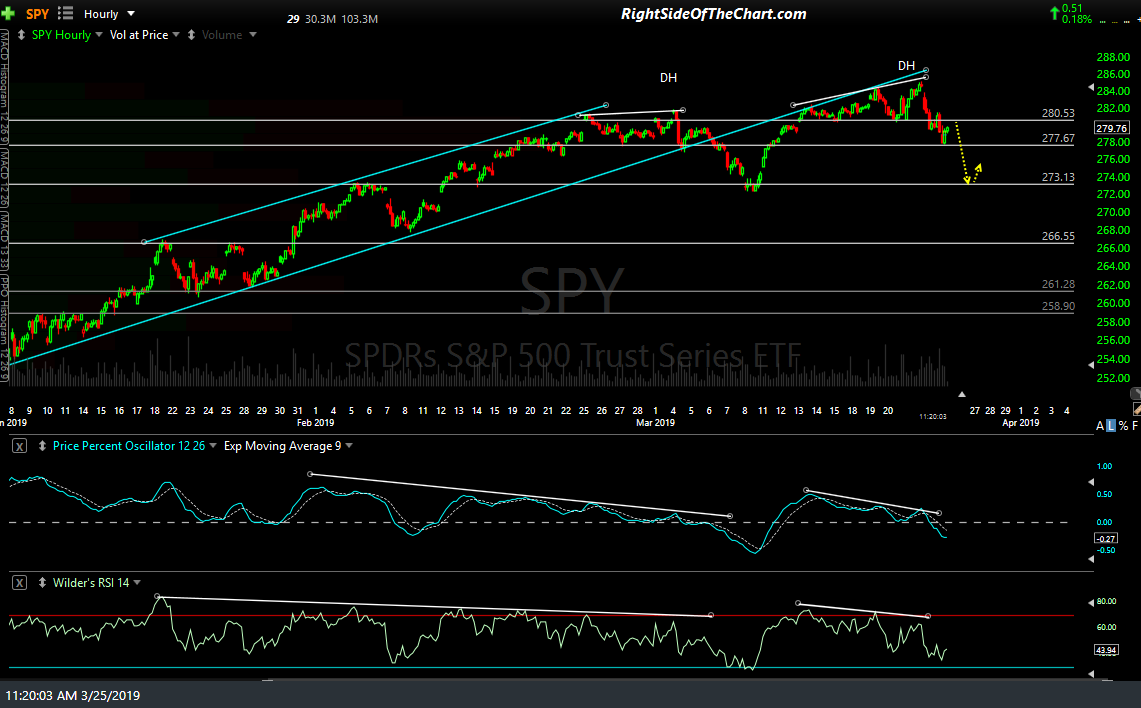
SPY 60-min 2 March 25th
QQQ is trading in no man’s land, smack between support & resistance with the PPO signal line (9-ema) still above the zero line although clearly pointing lower at this time. A solid cross below the zero line would indicate that the near-term trend has flipped from bullish to bearish, as it already has with SPY & IWM.

QQQ 60-min 2 March 25th
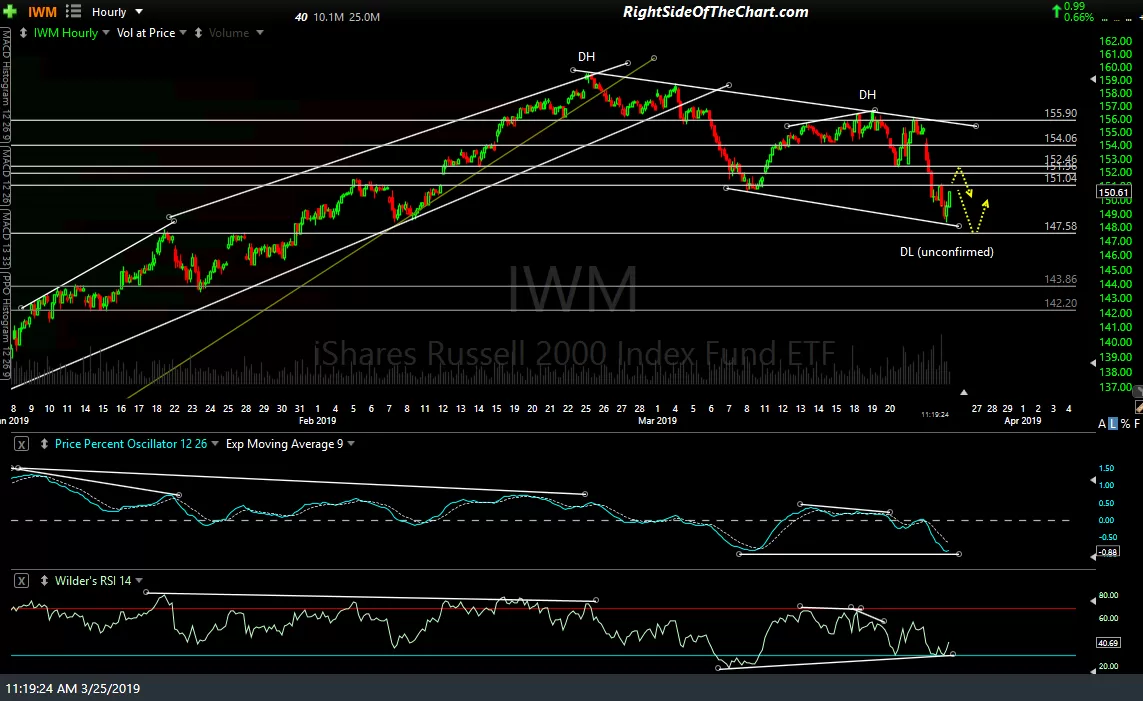
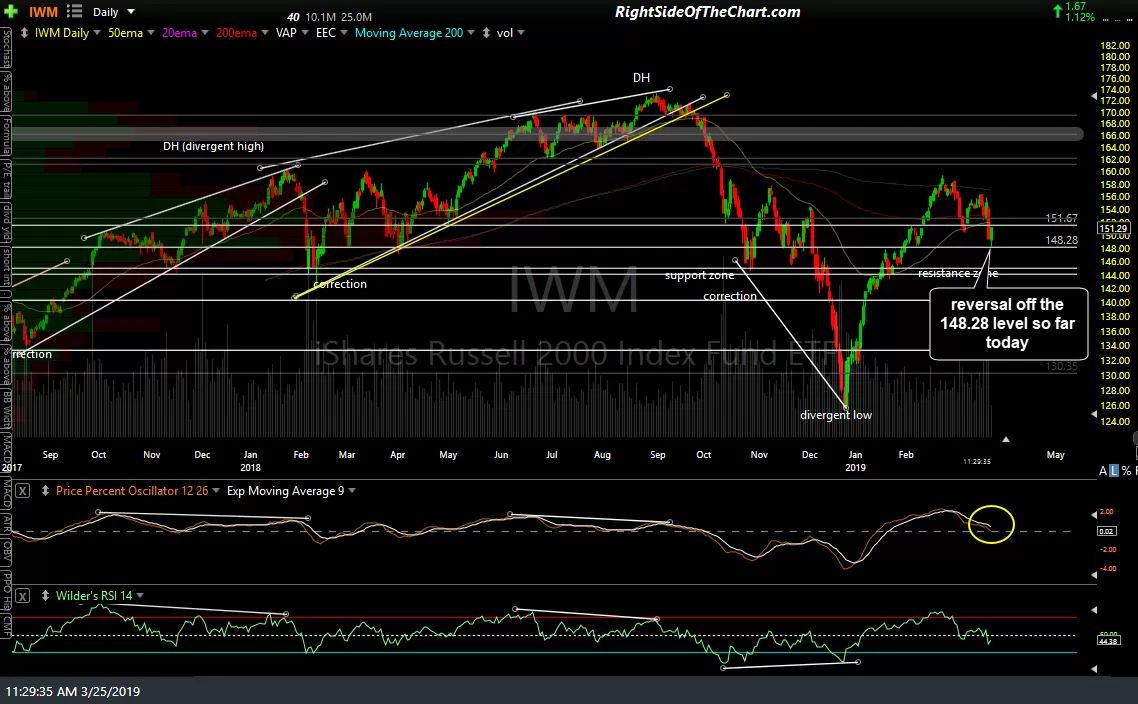
IWM (small cap ETF) has vastly underperformed QQQ & SPY (large caps) in recent weeks & reversed off the 148.28 support level on the daily chart after kissing it earlier today. With the rubber band much more stretched on IWM, the snapback rally has been relatively sharp so far today. The resistance zone which has the potential to cap this oversold rally comes in on the 60-minute charts from about 151 up to 152.50. Also, note the potential (unconfirmed) bullish divergences that are forming on the small caps, which would be confirmed if the rally does not stall out at or before the 152.50ish level, as I suspect it will.
-
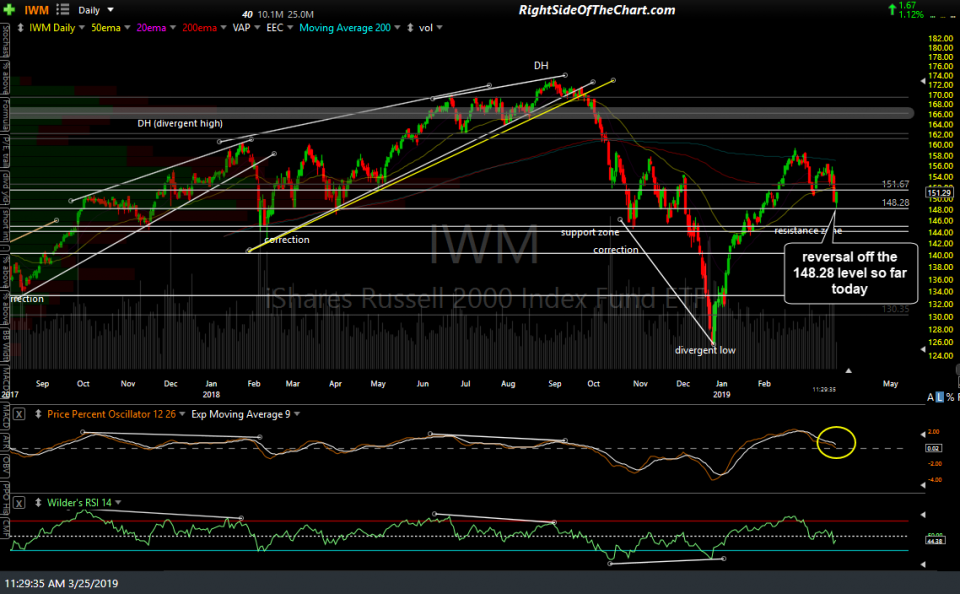
- IWM daily March 25th
-
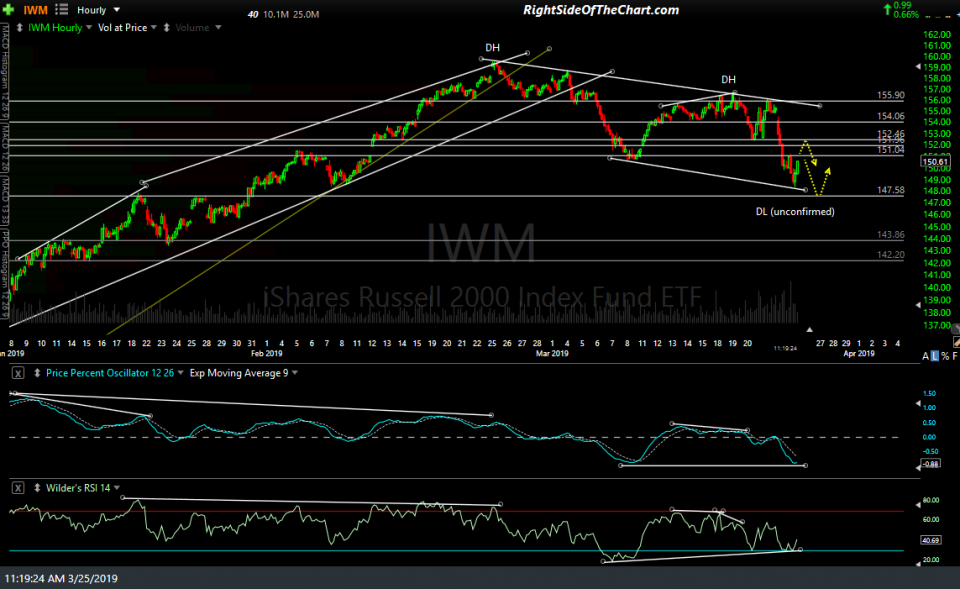
- IWM 60-min March 25th