
Here’s a quick look at the 60-minute charts of SPY, QQQ & IWM, all of which reversed on or around the initial tag of minor support levels, as expected, and will likely resume their near-term downtrends very soon, quite likely before the close of trading today.
The first chart below is the 60-minute chart of QQQ posted in the trading room yesterday morning followed by the updated 60-minute chart of QQQ. The Q’s reversed off the initial tag of the 182.64ish support level/backfill of the August 27th gap & will likely resume the downtrend at or before bouncing back to the 184.66 former support, now resistance level.
-
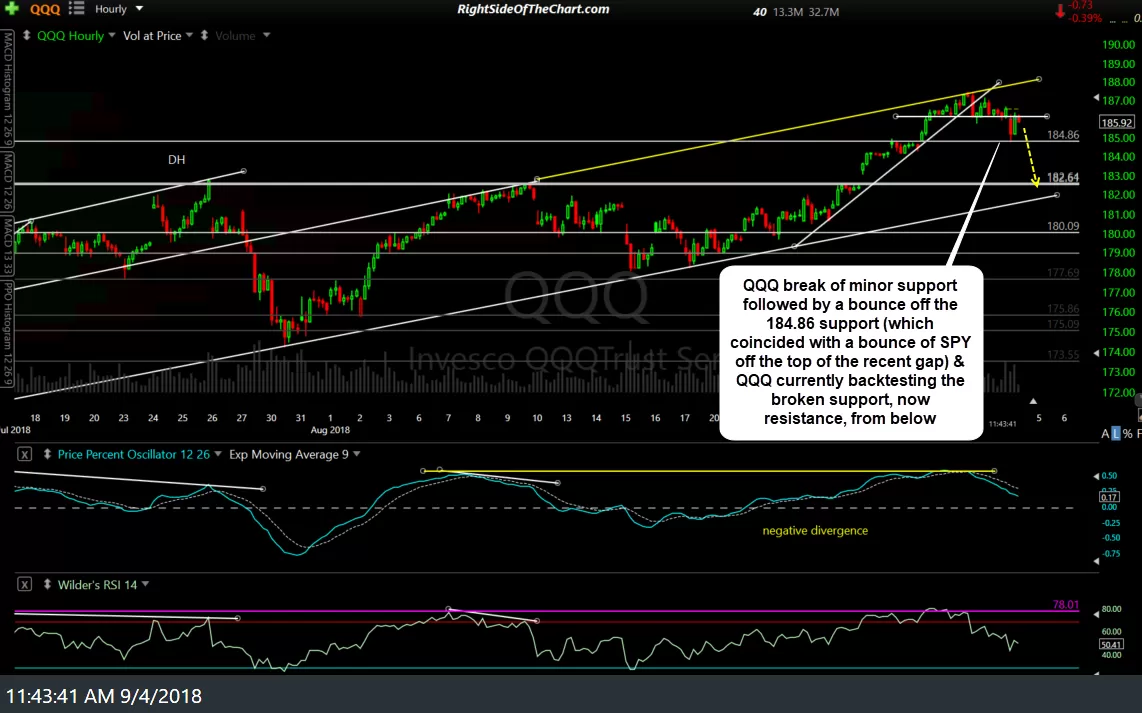
- QQQ 60-min Sept 4th
-
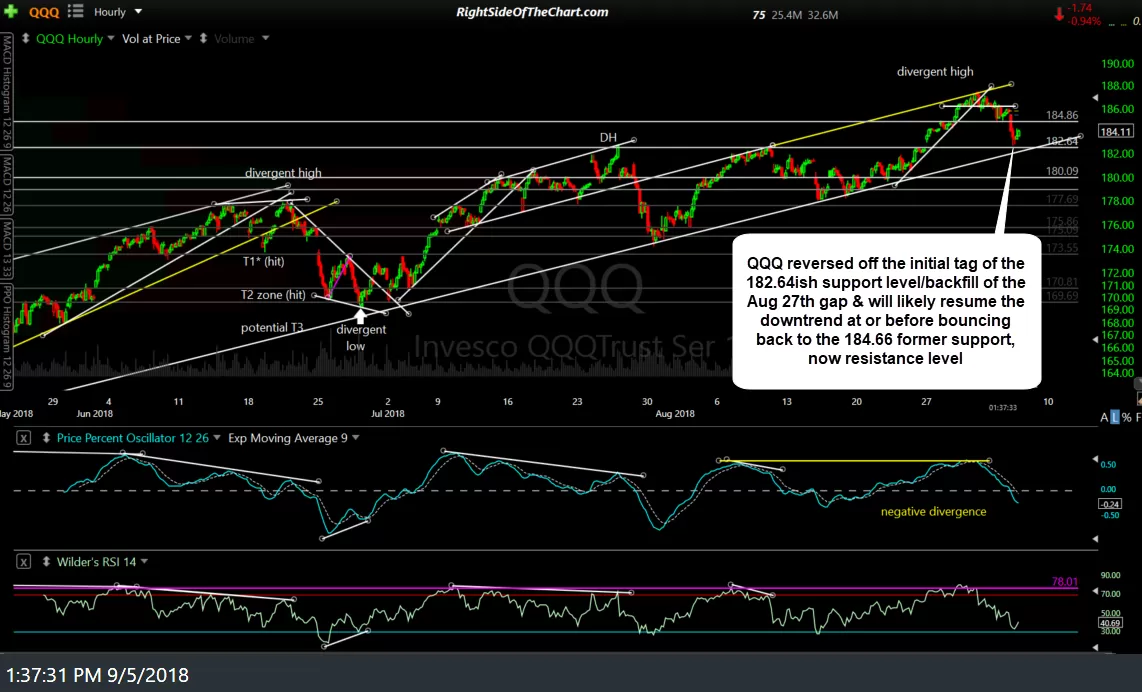
- QQQ 60-min Sept 5th
While I was remiss not to point out the bottom of that same August 27th gap on SPY as the most likely place for an initial reaction on SPY as well on the 60-minute chart of SPY also included in that trading room post early yesterday (below), the S&P 500 reversed after backfilling its comparable gap earlier today as well and has now run into the minor downtrend line resistance off the recent highs. This resistance level is a likely endpoint for the bounce following the gap backfill & likely starting point for the next thrust down to the 285.65 target area.
-
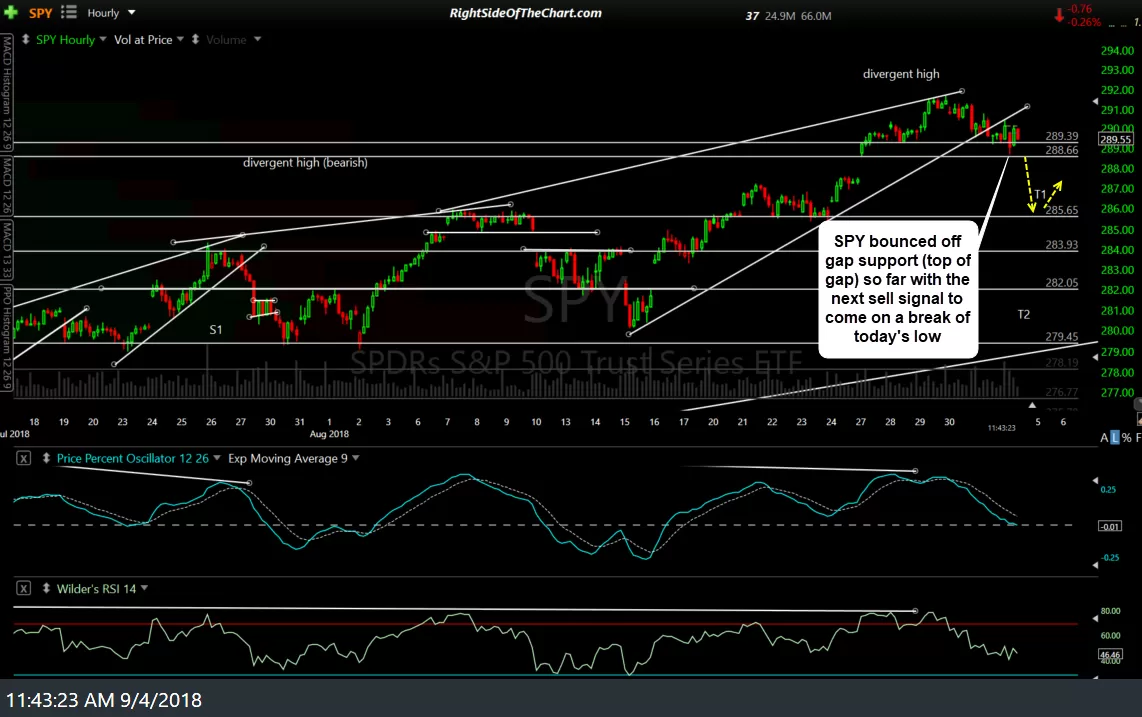
- SPY 60-min Sept 4th
-
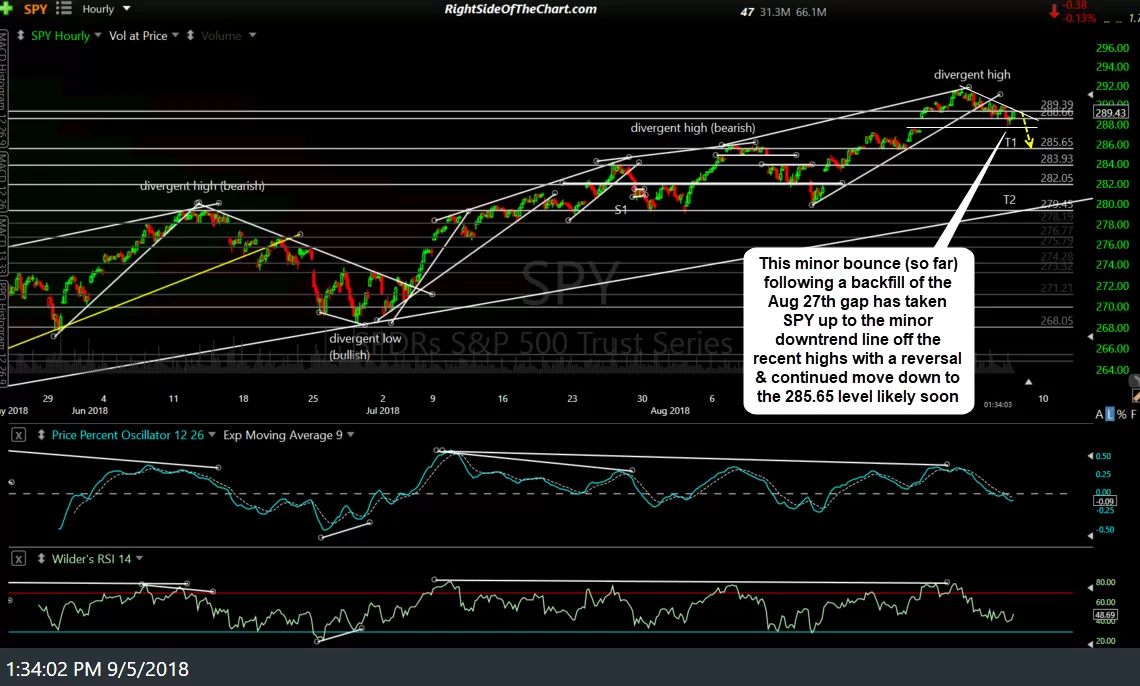
- SPY 60-min Sept 5th
Finally, IWM has made the expected bounce off the initial tag of the 170.40 support level as predicted in yesterday’s 60-minute chart (as indicated by the arrow break in the first below) & will likely begin the next thrust down to the 168.70 level very soon.
-
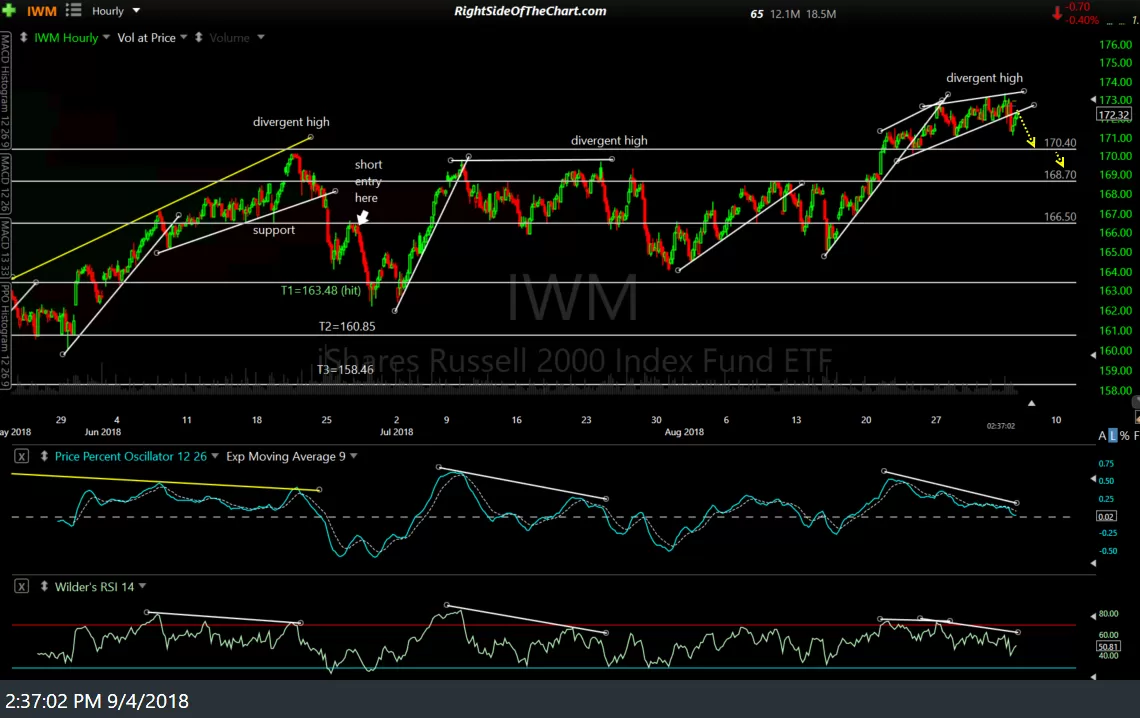
- IWM 60-min 2 Sept 4th
-
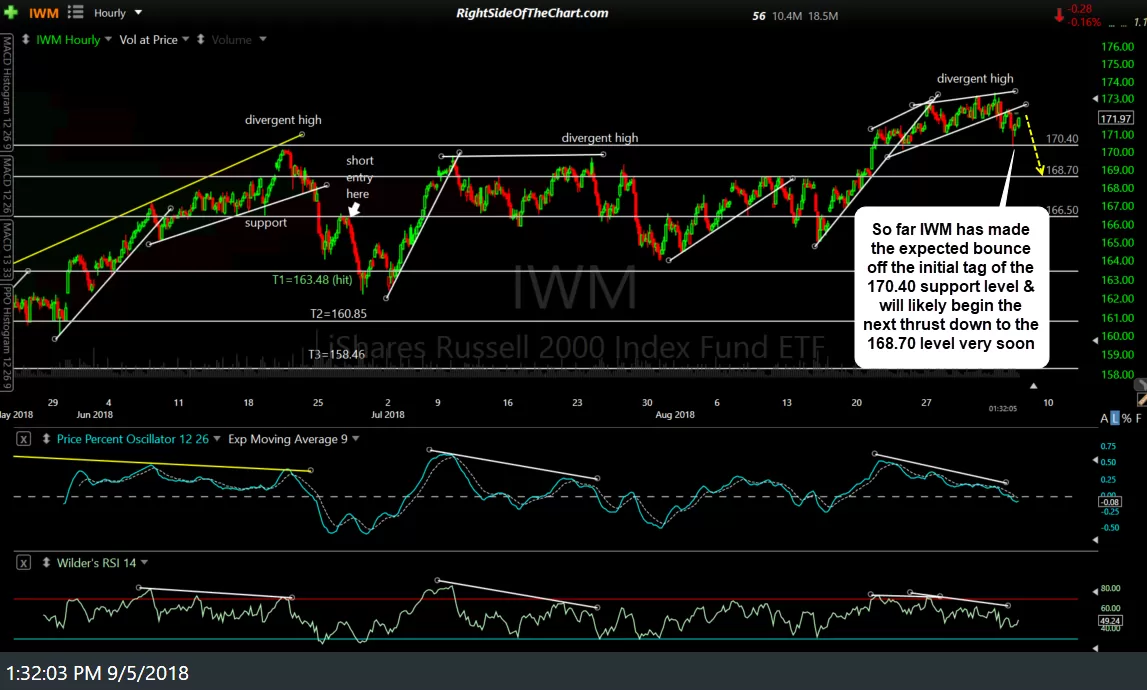
- IWM 60-min Sept 5th
Bottom line: While these scenarios for additional downside in the major US stock indices may or may not continue to play out, it does appear that this an objective time to either initiate new short positions or add back any shorts on the broad markets that were covered at those minor support levels earlier today.
Likewise, while it is not my preference or in alignment with my own near-term outlook for the markets, those bullish looking to buy the dips could have added on the gap backfills today or could wait until my next downside price targets are hit.