
/NQ (Nasdaq 100 futures) & QQQ (Nasdaq 100 ETF) will offer objective short entries on a break below this 60-minute bullish falling wedge as well as a break below the comparable 60-minute uptrend lines on /ES & SPY. 60-minute chart of /NQ below.
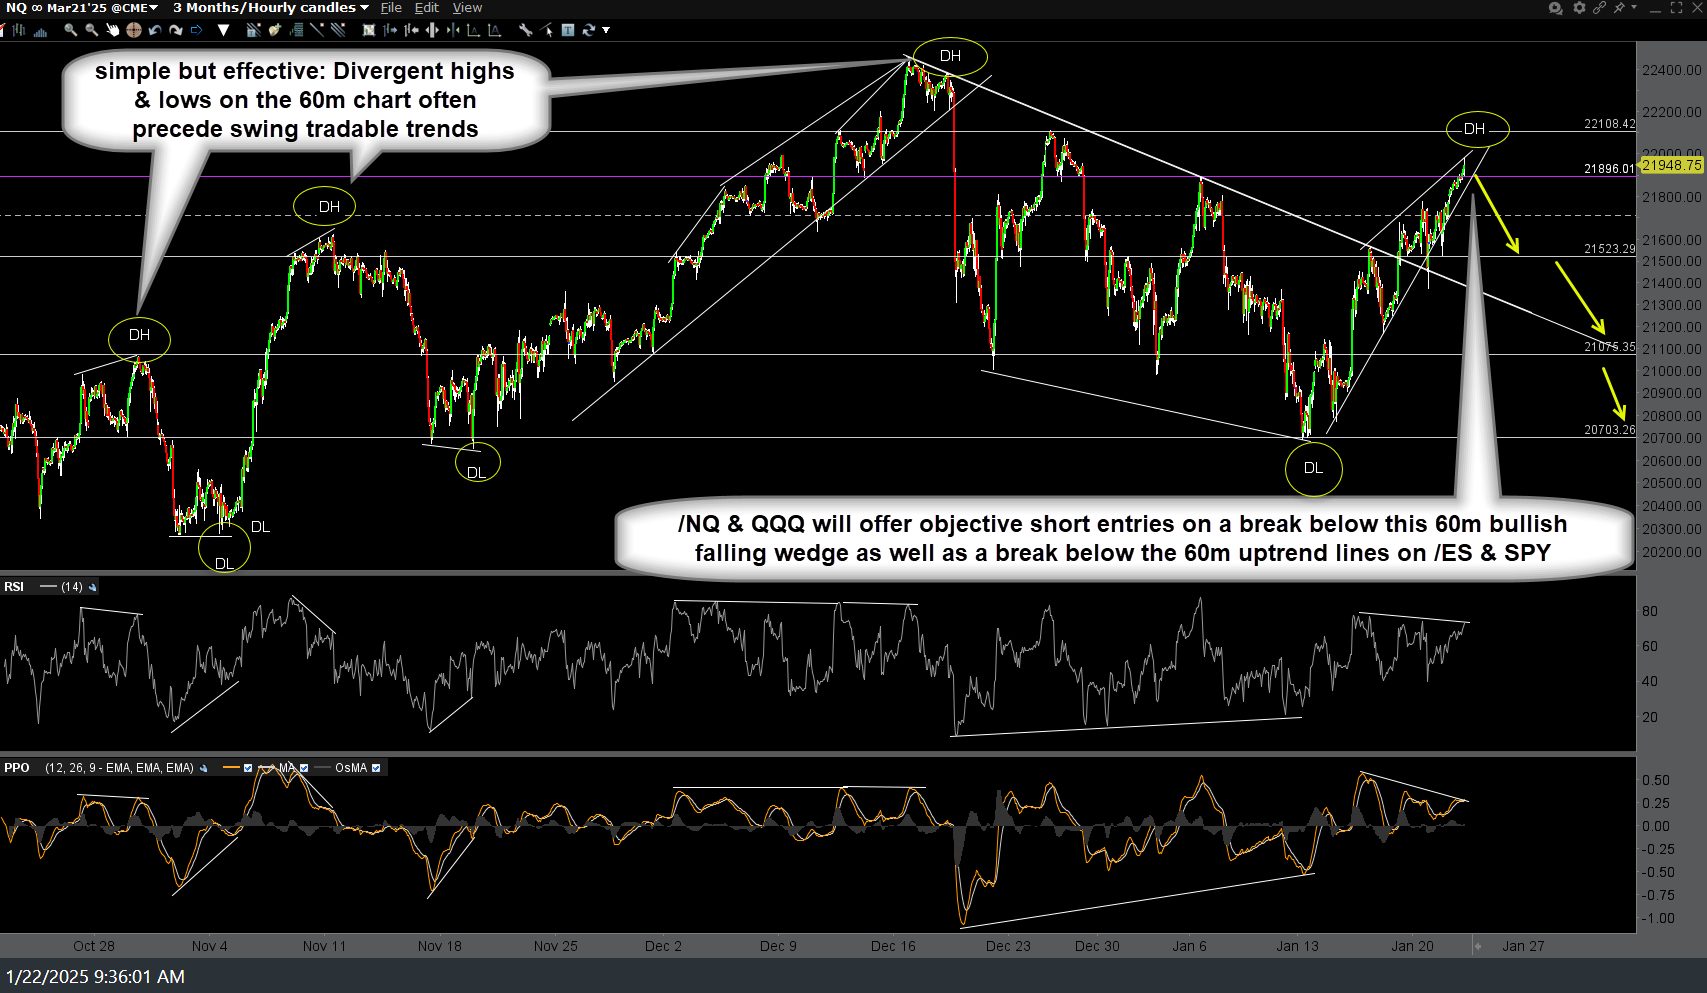
NQ 60m Jan 22nd
/ES (S&P 500 futures) & SPY (ETF) sell signal to come on a solid break below this steep 60-minute bearish rising wedge pattern along with a comparable breakdown on /NQ and QQQ. 60-minute chart of /ES below.
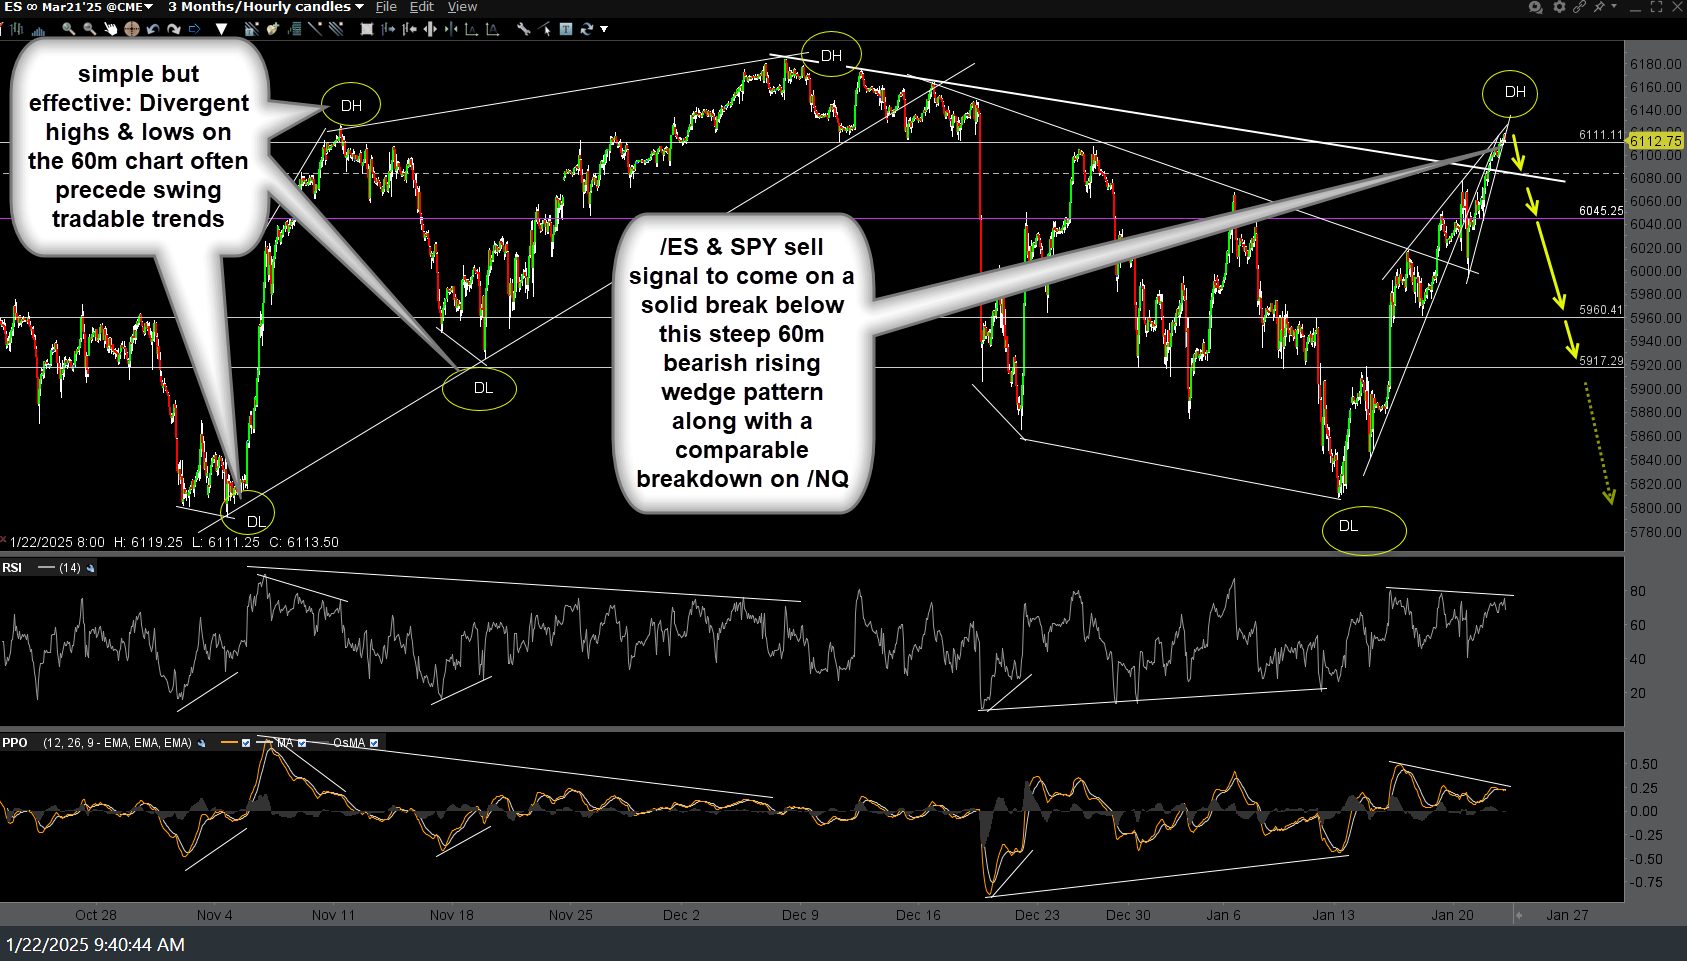
ES 60m Jan 22nd
As highlighted in yesterday’s video, /RTY (Russell 2000 Small-cap Index futures) & IWM (ETF) still offer objective short entries here at downtrend + price resistance with negative divergences although best to wait for the aforementioned sell signals on the large-cap indices, ideally on a 60-minute or daily closing basis before going to a full position. 120-minute chart below.
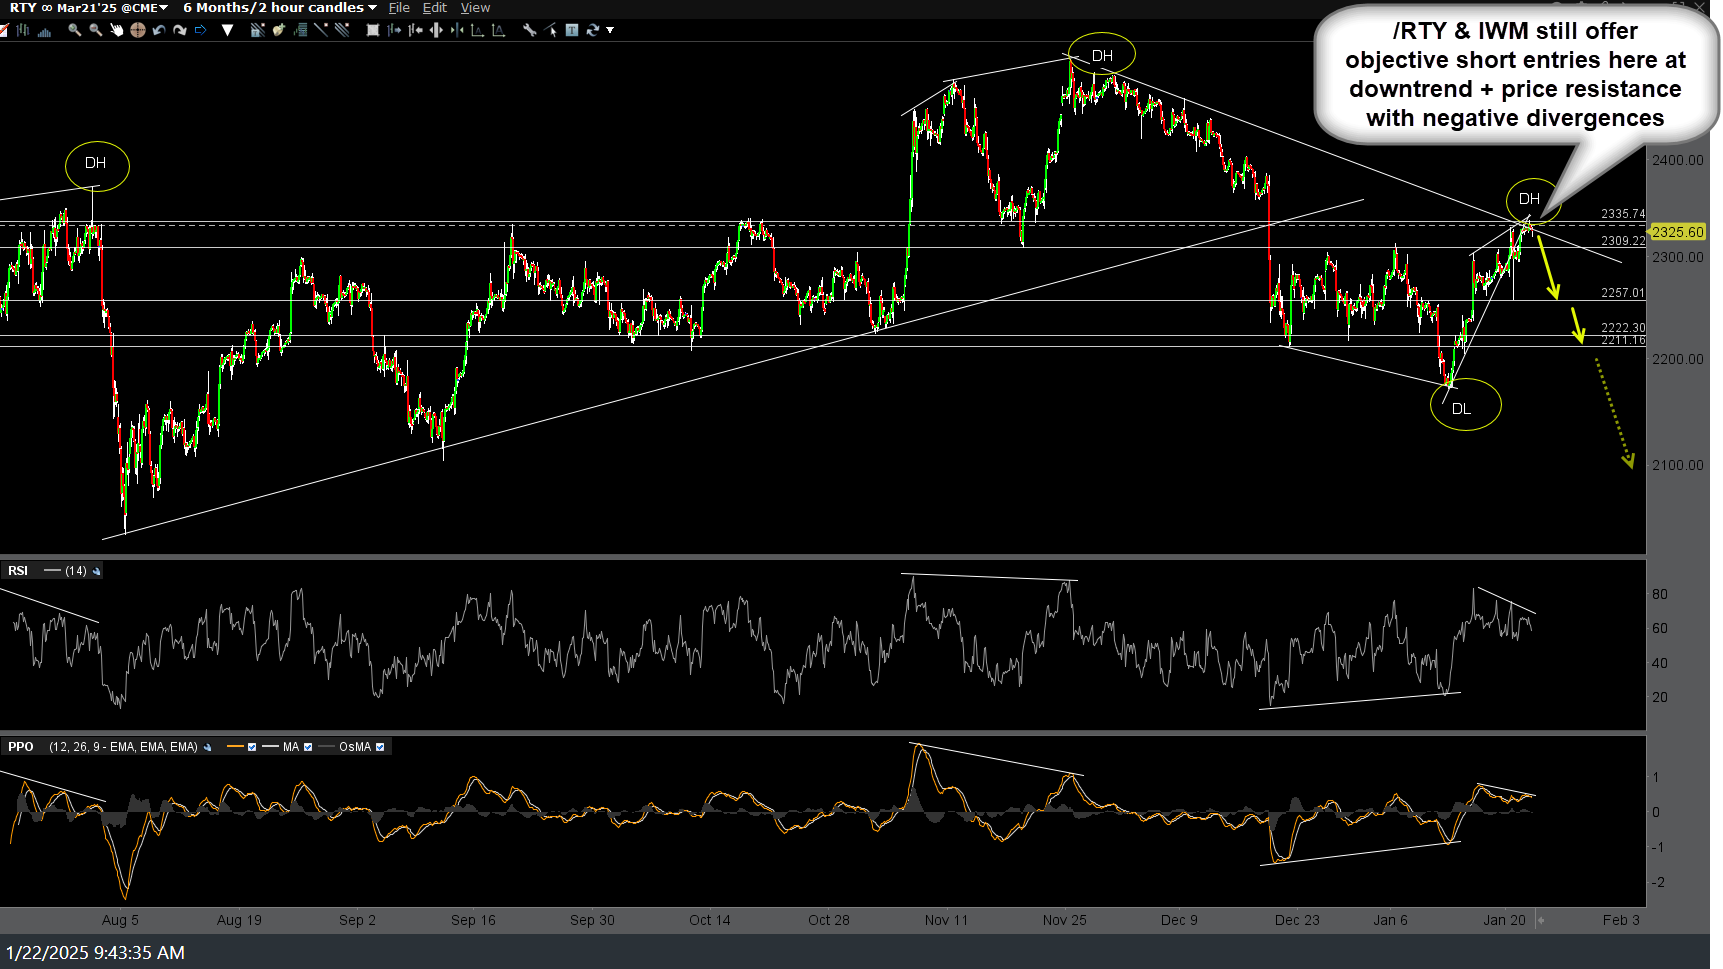
RTY 120m Jan 22nd