
A reversal in U.S. equities “may“ be close at hand but I should be clear that a meaningful reversal may still not occur until the market has moved much lower. Most of you know that I strive to avoid doublespeak, usually sharing my thoughts on where the market is likely headed unless my read on the market just isn’t strong enough to have an opinion worth sharing. I’ve never been a big fan of providing C.Y.A. analysis (“the market might go up…. or it might go down”). With that being said, I can make a pretty solid case either way, and will below, although I should be clear that the trend is bearish for now an as such, there is still some work to be done to firm up the bullish case discussed below.
My thoughts, in a nutshell, are this: We are either at or very close to a meaningful reversal in U.S. equities or the selling that we’ve seen since I’ve highlighted the 60-minute rising wedge breakdowns in this post back Friday Sept 18th is just the start of the next major thrust down that projects down to around the 1790 level in the $SPX, about another 4 ½% below where the markets closed yesterday.
Let’s start with the bullish case. Below are two 60-minute charts of the $SPX, the previous chart posted here on Thursday along with the updated chart (as of yesterday’s close). In that post I had pointed out that just as with the recent reaction high back on Sept 17th which was marked by an overbought reading on the RSI (along with the other significant prior reaction highs) that the markets would likely continue lower until the RSI crossed below 30 (oversold) before any significant reversal.
-
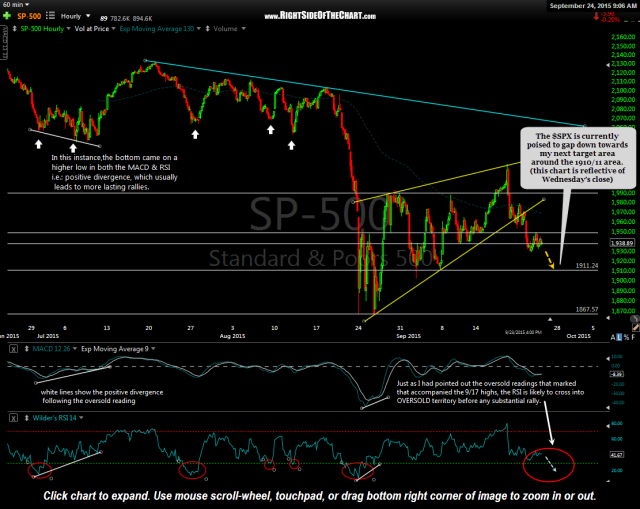
- $SPX 60 minute Sept 24th
-
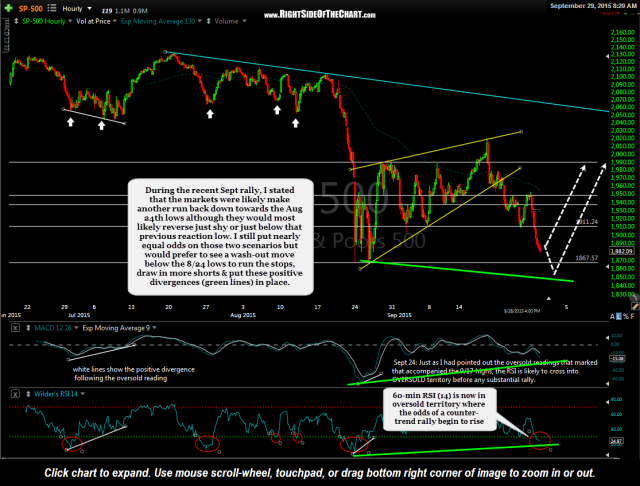
- $SPX 60 minute Sept 29th
The RSI is now clearly in oversold territory but as I often state, crosses above & below overbought & oversold levels are not exact timing indicators. What we need to see now would be some evidence of a reversal such as a bullish candlestick reversal pattern. Something else that I had stated a couple of weeks ago when the market was rallying towards the Sept 17th highs was that my expectation was for another move down to at least the Aug 24th lows but that most likely, the market would either reverse just shy of those lows or punch down through the lows in order to washout the last of the longs & suck in some new shorts before mounting a more lasting rally.
As the green lines on the updated 60 minute chart illustrate, such an undercutting of the Aug 24th lows, assuming that the $SPX reversed not too far beyond there, would also put in place some strong positive divergences. When looking for a counter-trend rally worth reversing my current swing-trade positioning (i.e.- reversing from net-short to net-long during a downtrend such as this), I prefer to see positive divergences in place on the 60-minute time frame. Bullish divergences on shorter-time frames (e.g.- 5-minute, 15-minute, etc…) usually don’t play out or get sold into just as the reversal looks to be gaining some traction, at least that has been my experience.
Therefore, I am currently on the lookout for a potential reversal either at or somewhat below where the markets closed yesterday. I favor the undercutting of the Aug 24th lows but whether that happens or not, I will start to trail down stops on many of my short positions after the first 30 minutes or so of trading today. This will allow me to “stay in the game” if the more bearish scenario (discussed next) plays out while protecting gains, should a substantial (i.e.- multi-week+) rally kickoff here soon.

$SPX daily Sept 29th
The bearish scenario is pretty simple & very much on the table IMO. I’ve discussed recent how the rally off the Aug 24th lows has the look & feel of a bull flag/bearish pennant continuation pattern. Although bit on the larger-side for a bearish pennant, if indeed that pattern is in play, then it would indicate a very swift move down towards the 1790 area. Looking at this daily chart of the $SPX, although there is some potential divergence forming, it is not nearly close enough yet and to add to that, the MACD has just recently made a bearish crossover & is current pointed nearly straight down (bearish). At the very least, we want to see the MACD start to curl back up.
My read on this chart is that the $SPX is likely headed considerable lower in the coming weeks to months and just as I like to see positive divergence in place on the 60-minute time frame to reverse my positioning for a counter-trend trade, I also prefer to see positive divergence in place on the daily time frame before positioning for a major trend change. Remember, all of the evidence for a major top in the market that I posted on the site earlier in the year such as long-term divergences, market breadth deterioration, bullish complacency levels not seen in many years & even decades, etc.. is all factored into this analysis as well.