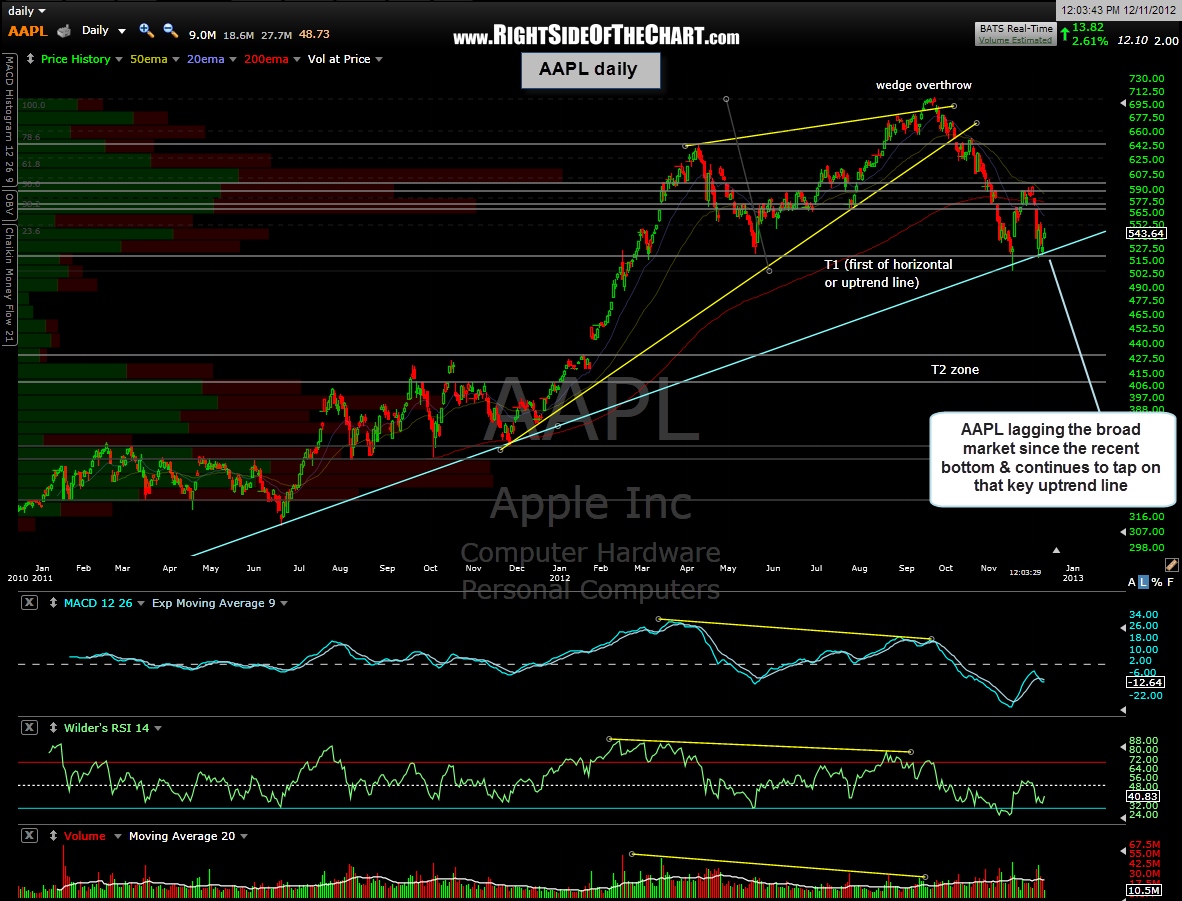
Close to half way into the trading session and we have what could likely turn out to be a trend day (where the market moves away from it’s opening price range and does not go back to that same price range throughout the day, usually closing near it’s highs for the day). If that proves to be the case, then most of the broad markets such as the $SPX, $COMPQ & $RUT will have taken out some key resistance levels that I’ve recently highlighted. AAPL, although outpacing the market today, continues to lag overall on the bounce since the lows back on Nov 16th (a bearish and significant event IMO).
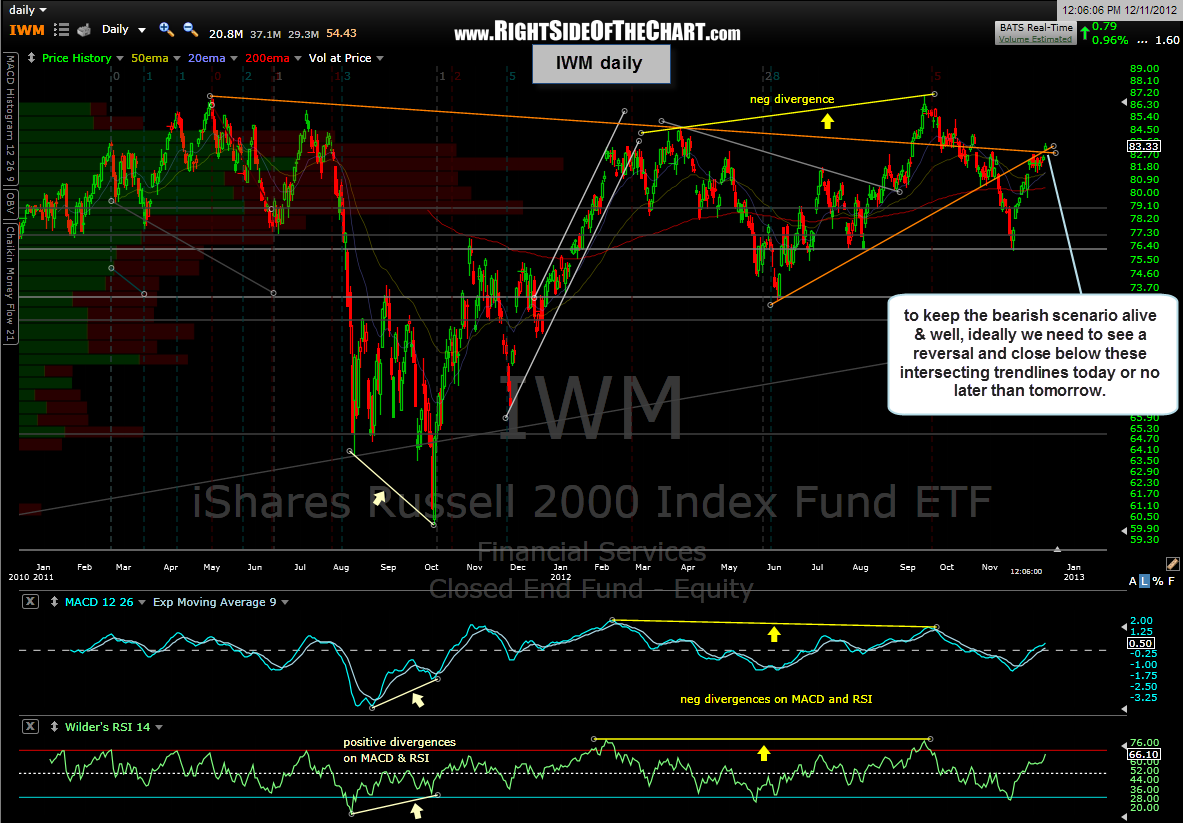
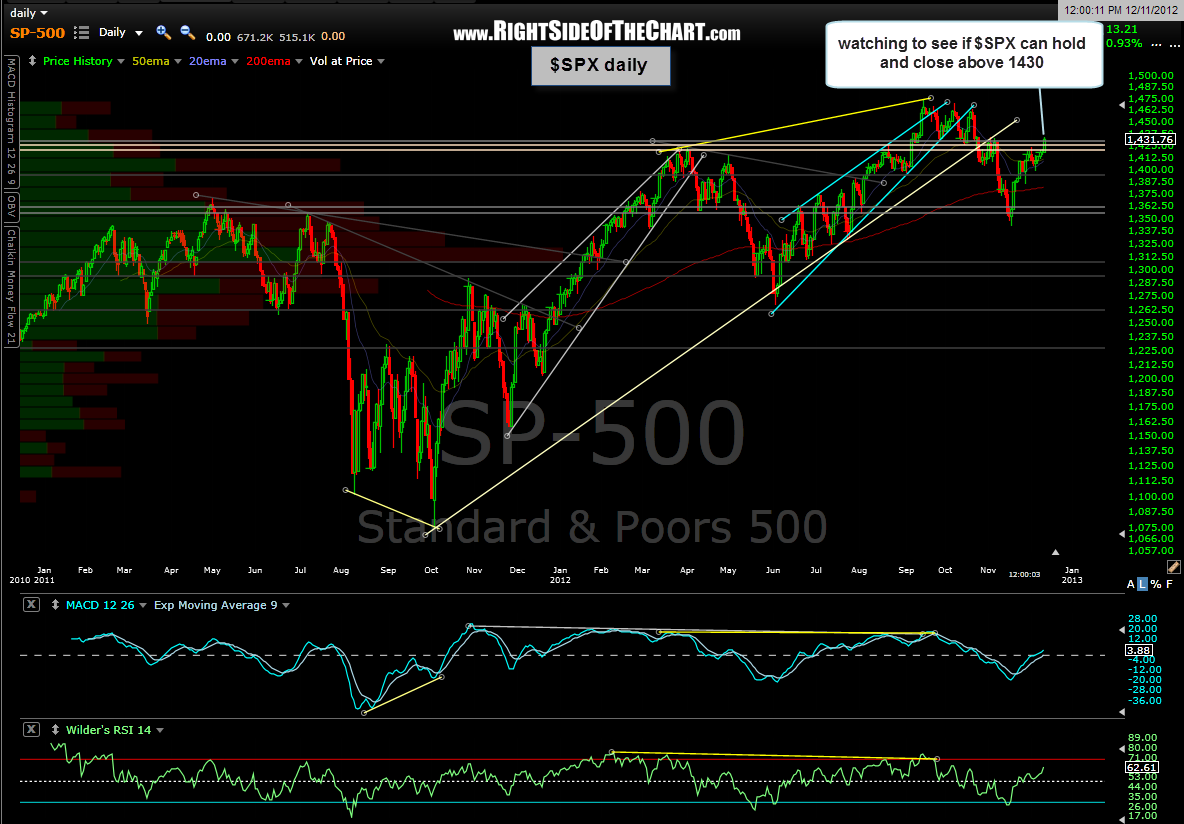
Looking at similar past junctures in the market, the ideal case to keep the bearish scenario alive and well would be an intraday reversal in the market and a close at, near or especially below today’s open. If the markets do end up closing near the highs today, I will likely start reducing my short exposure and continue to do so tomorrow if the markets were to follow thru to the upside (waiting until after the typical knee-jerk reactions from the Fed announcement and subsequent press conference tomorrow afternoon). On the flip-side, I will likely add to my short exposure if the markets do make a 180° today and manage to close well off the highs.
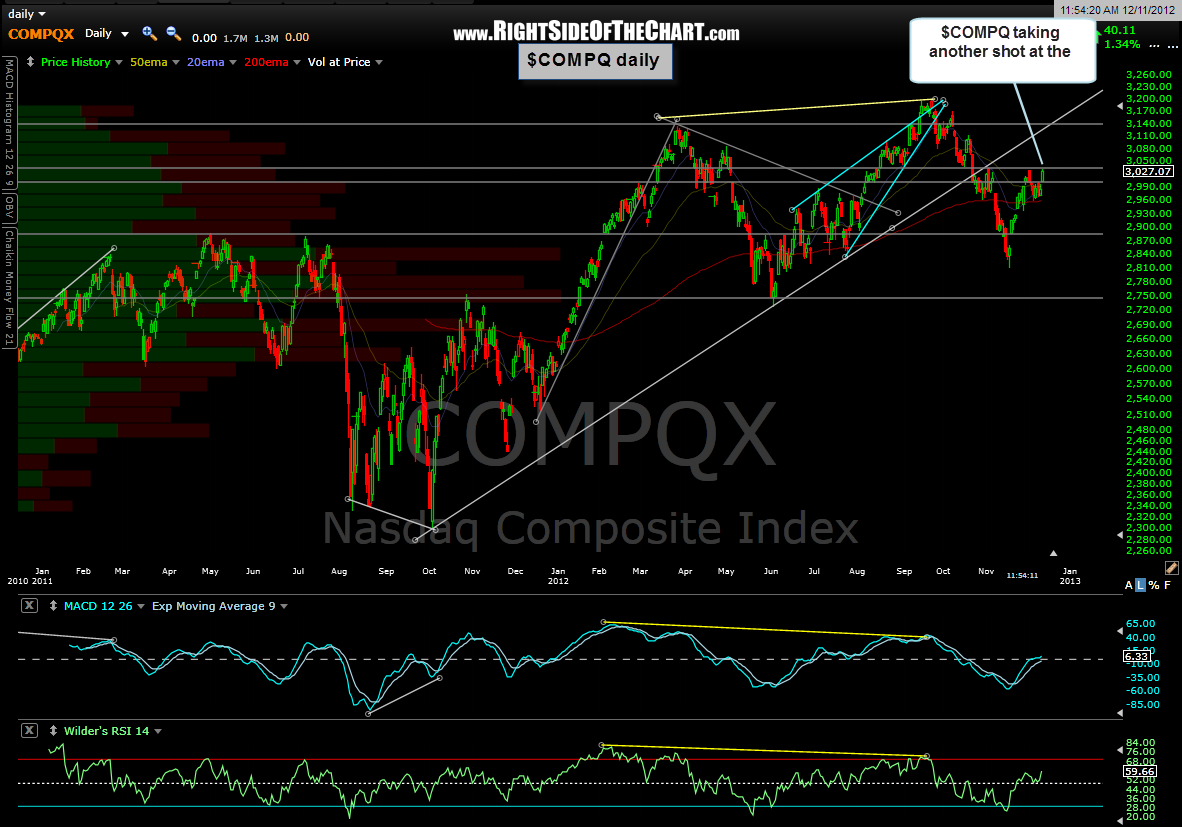
Remember, these current resistance levels that the markets are testing are not the final levels that determine whether the next 20% in the market is up or down. In fact, as mentioned a couple of weeks ago, the leading index ($NDX) as well as the broader $COMPQ are both still well shy of 61.8% fib retracement level from the recent sell-off. Often, retracements of initial legs down in new bear trends have exceed even those levels, although I would much prefer those indices to turn down at or before the 61.8% retracement. Below are the updated $SPX, $COMPQ, IWM and AAPL daily charts.