
I’ll post a more comprehensive update on the broad market later today but wanted to reiterate that although much of my focus has been on the 60-minute charts of the major indexes, all major indexes are still trading on or above their primary uptrend lines on the much more technically significant weekly charts. As such, until these trendlines on not just the SPY (S&P 500) and QQQ (Nasdaq 100) are taken out on a solid weekly closing basis, which is very unlikely to happen today (i.e.- with this week’s weekly candle) barring a very strong decline & solid red close on both S&P 500 & especially QQQ/the Nasdaq 100, the primary uptrend is still intact without any major sell signals on the stock market at this time.
-
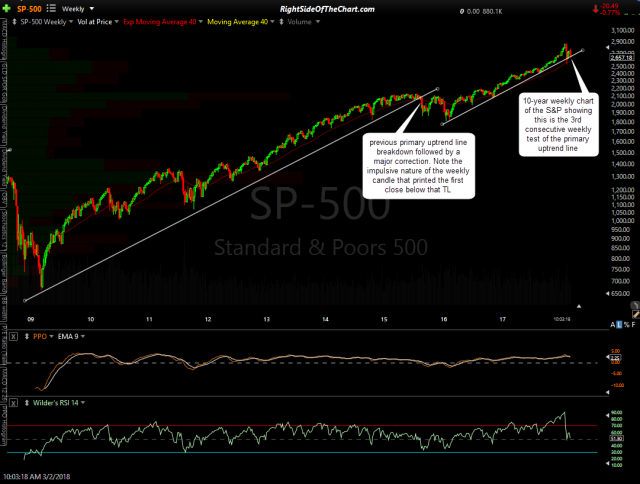
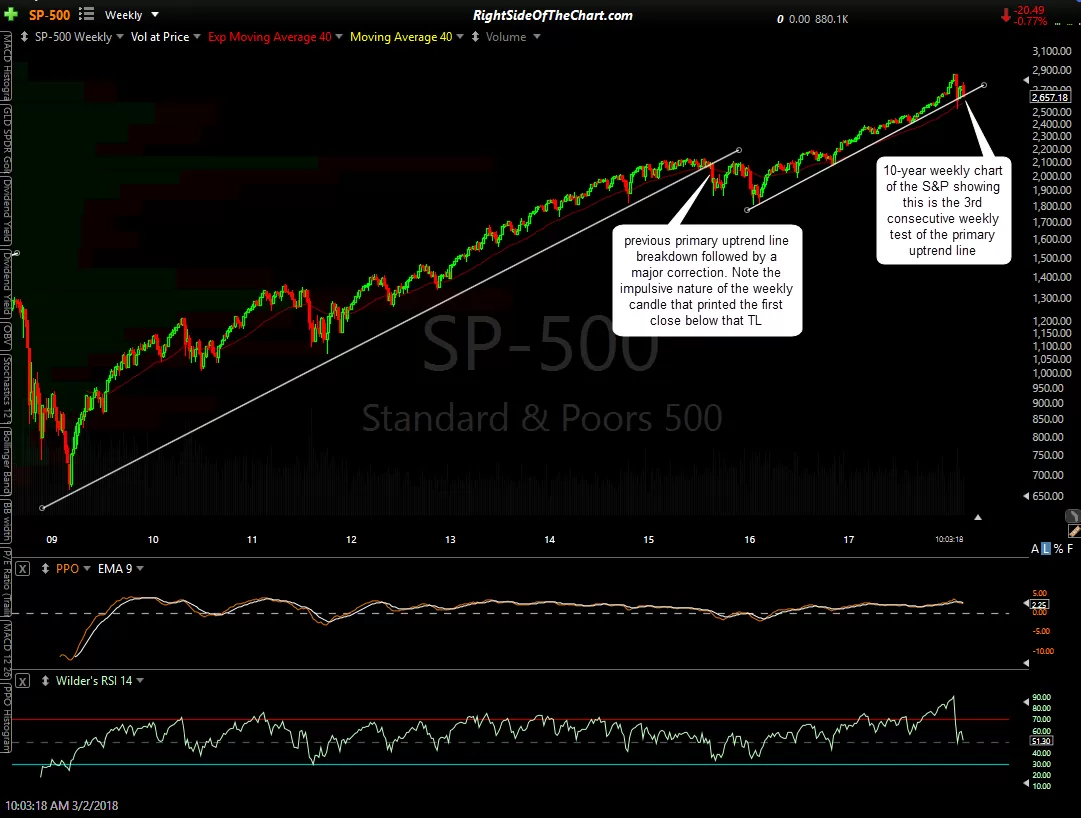
- $SPX 10-yr weekly March 2nd
-

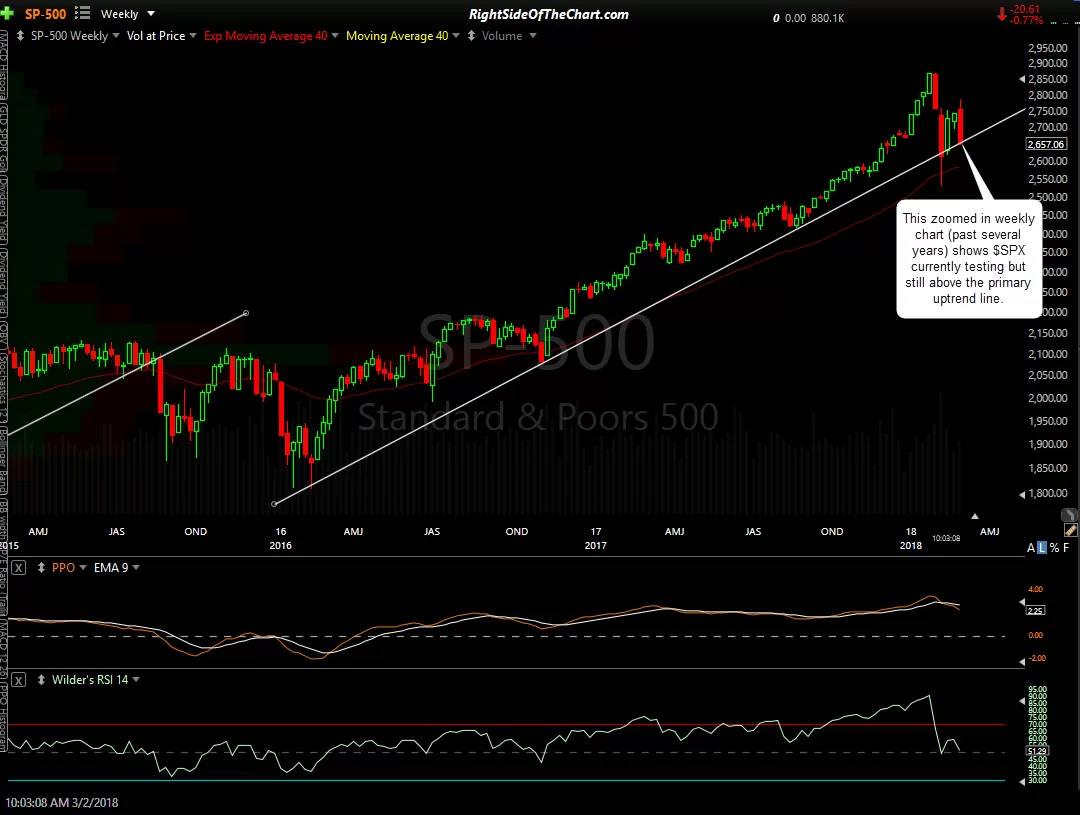
- $SPX 3-yr weekly March 2nd
-

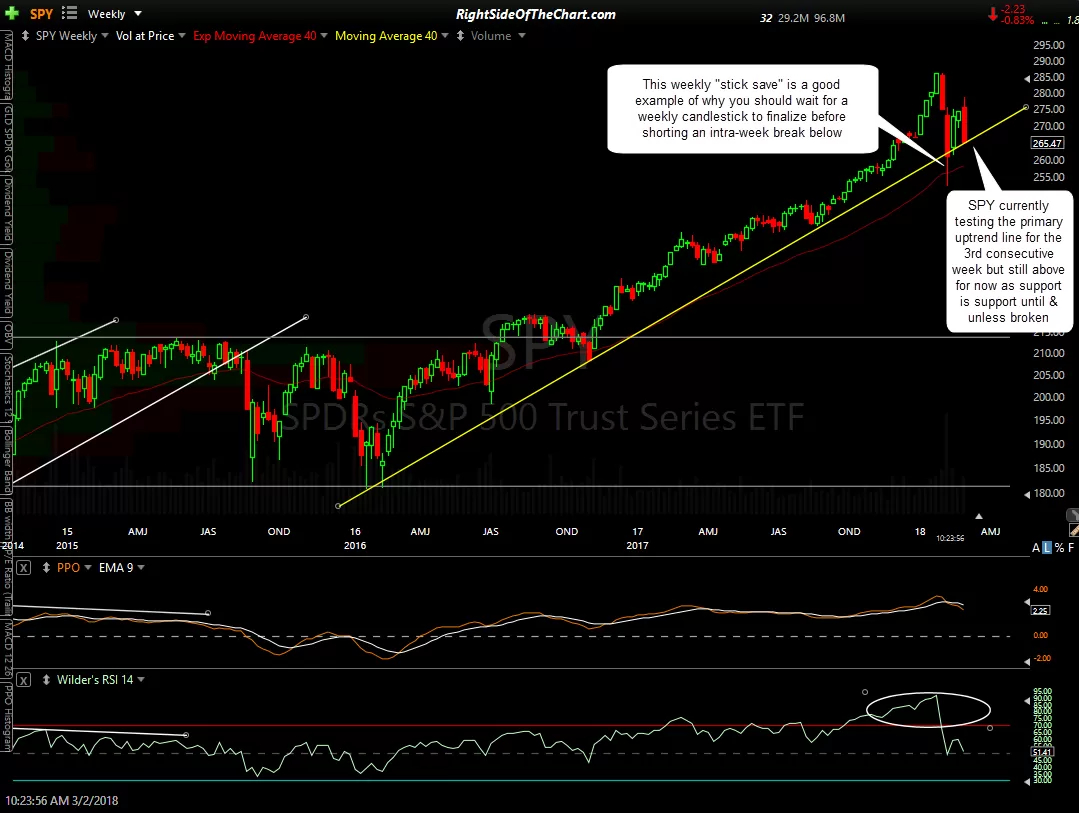
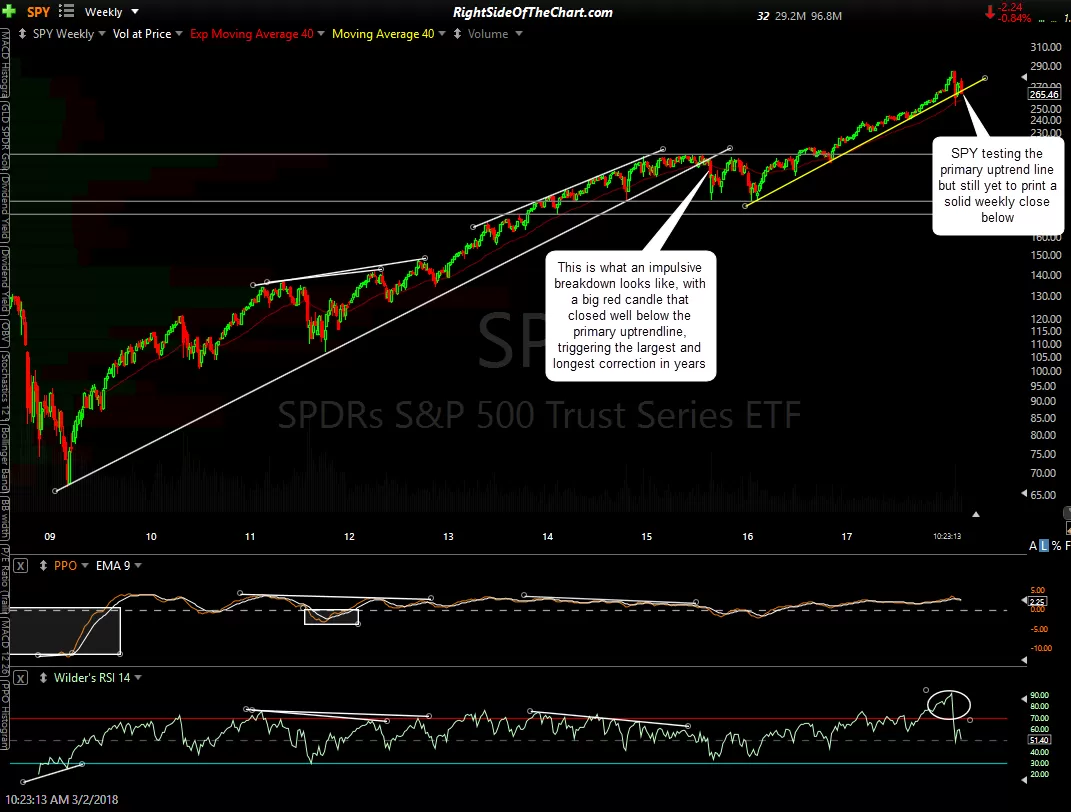
- SPY 3 yr weekly March 2nd
-
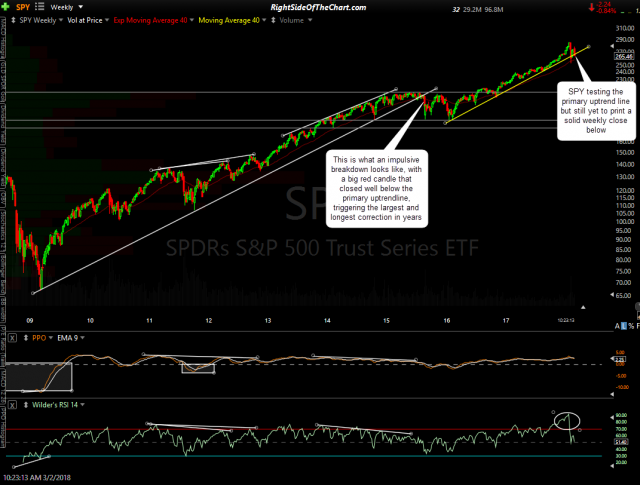
- SPY 10 yr weekly March 2nd
-

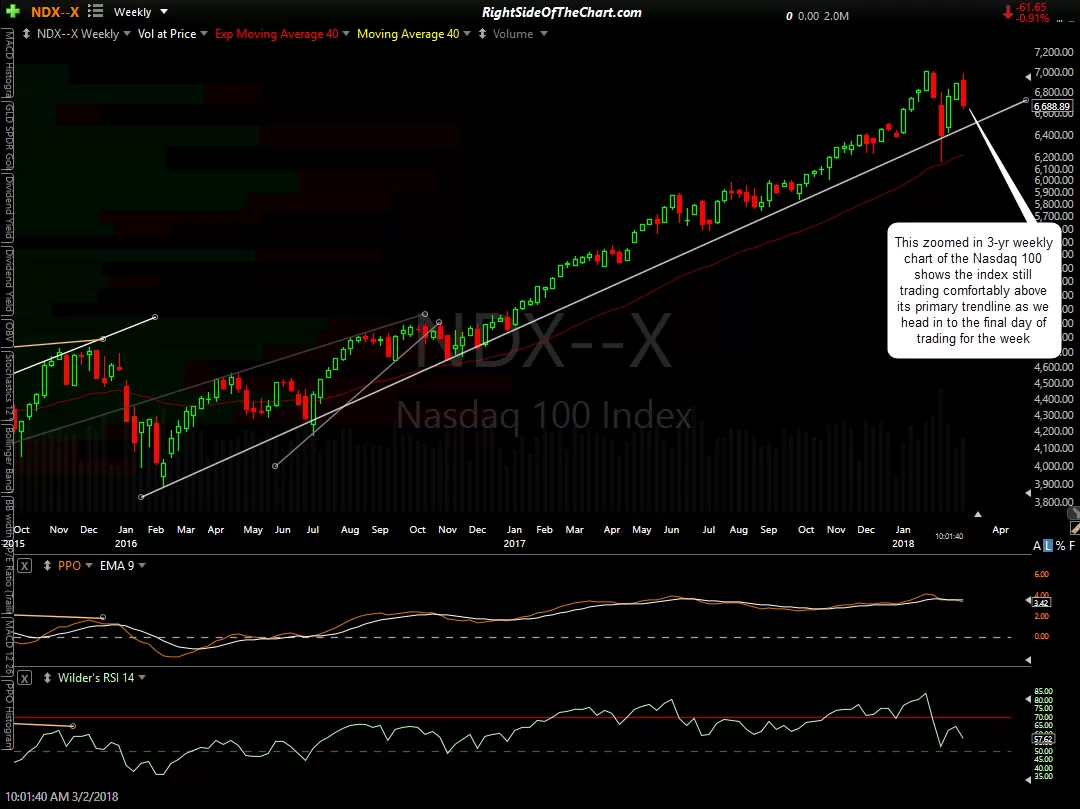
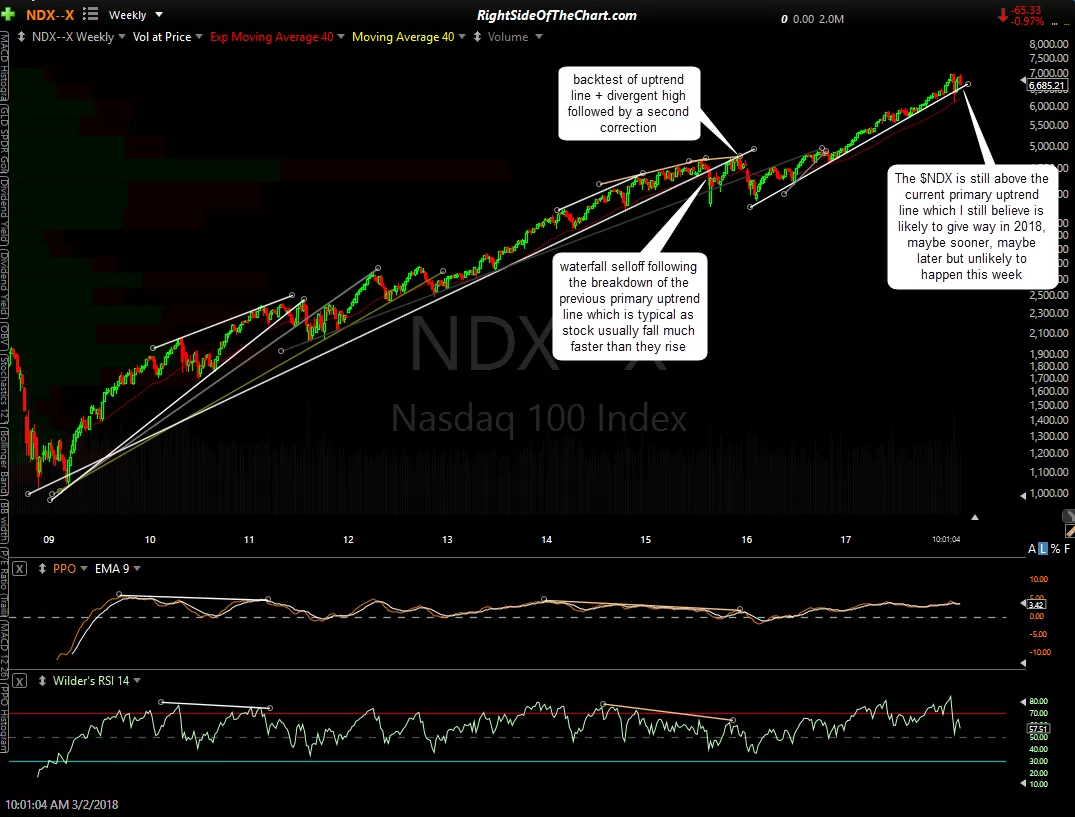
- $NDX 3-year weekly March 2nd
-
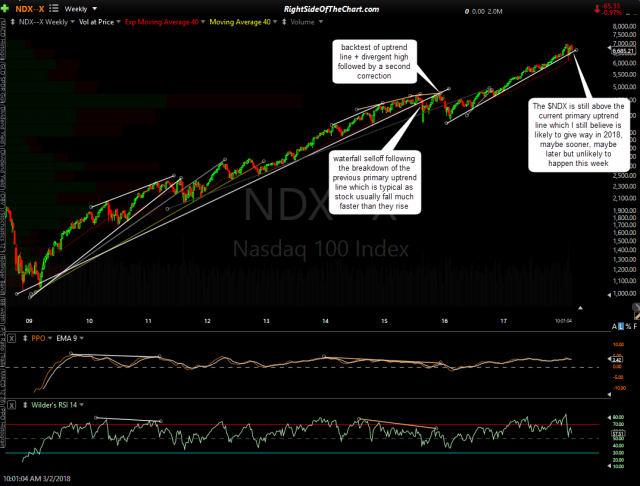
- $NDX 10-yr weekly March 2nd
-
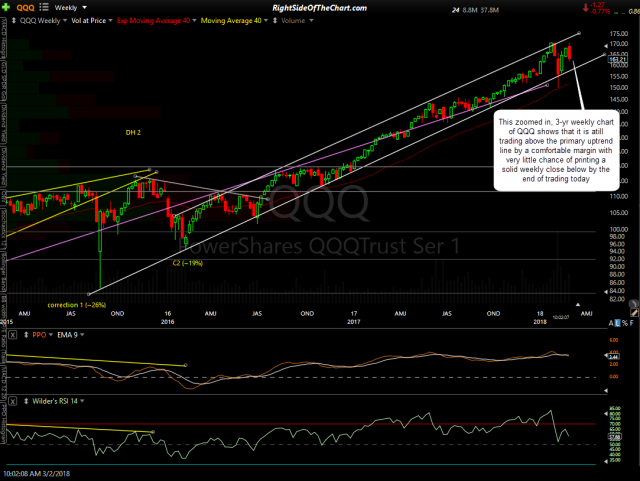
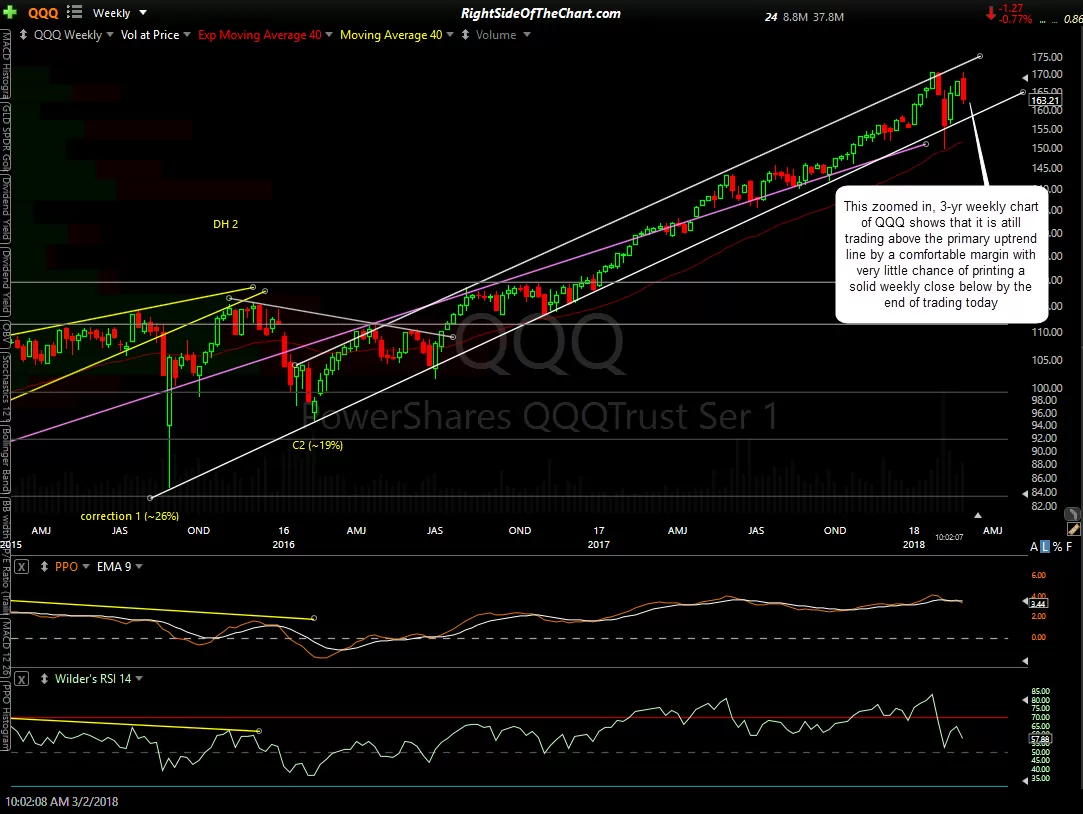
- QQQ 3-yr weekly March 2nd
-
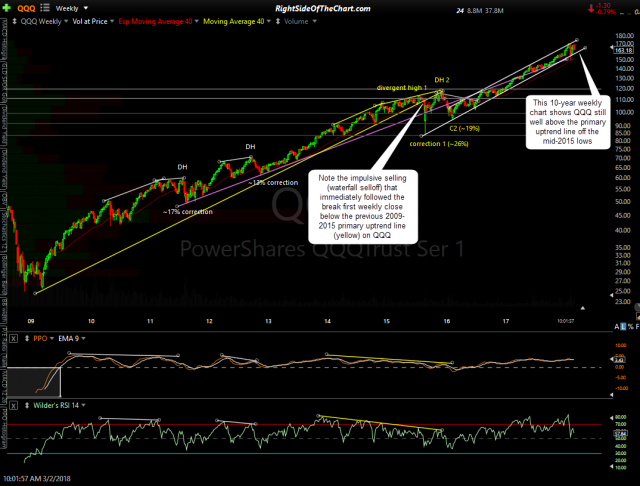
- QQQ 10-year weekly March 2nd
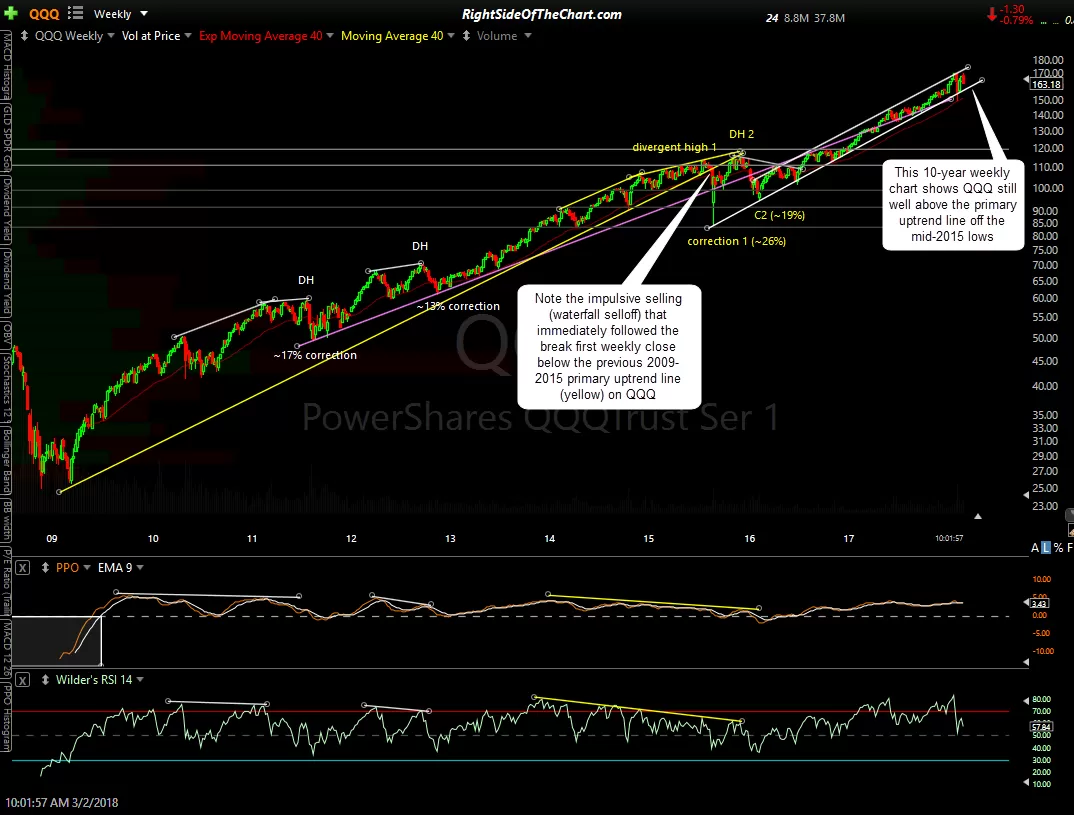
On a computer: Click the first chart to expand to full size, then click anywhere on the right of each chart to advance to the next expanded image. Once expanded, charts can be panned & zoomed for additional details. Use pinch to zoom feature on tablets & phones.
Shown above are the 10-year weekly charts of SPY, the S&P 500, QQQ & the Nasdaq 100 along with a zoomed in weekly chart of the past few years with a better view of the proximity to the trendlines. SPY/$SPX is currently testing its primary uptrend line but again, to minimize the chance of a whipsaw sell signal, you would want to see a solid weekly close below these trendlines on both of the major large cap indices.