
The SOXX (semiconductor ETF) swing short trade has just hit the 446ish target on the daily chart with potential positive divergences forming between price & the momentum indicators. As such, I have just reversed from short to long with stops somewhat below in order to attempt to game a bounce off this support level. Previous (Sept 11th/Oct 25th) & updated daily charts below.
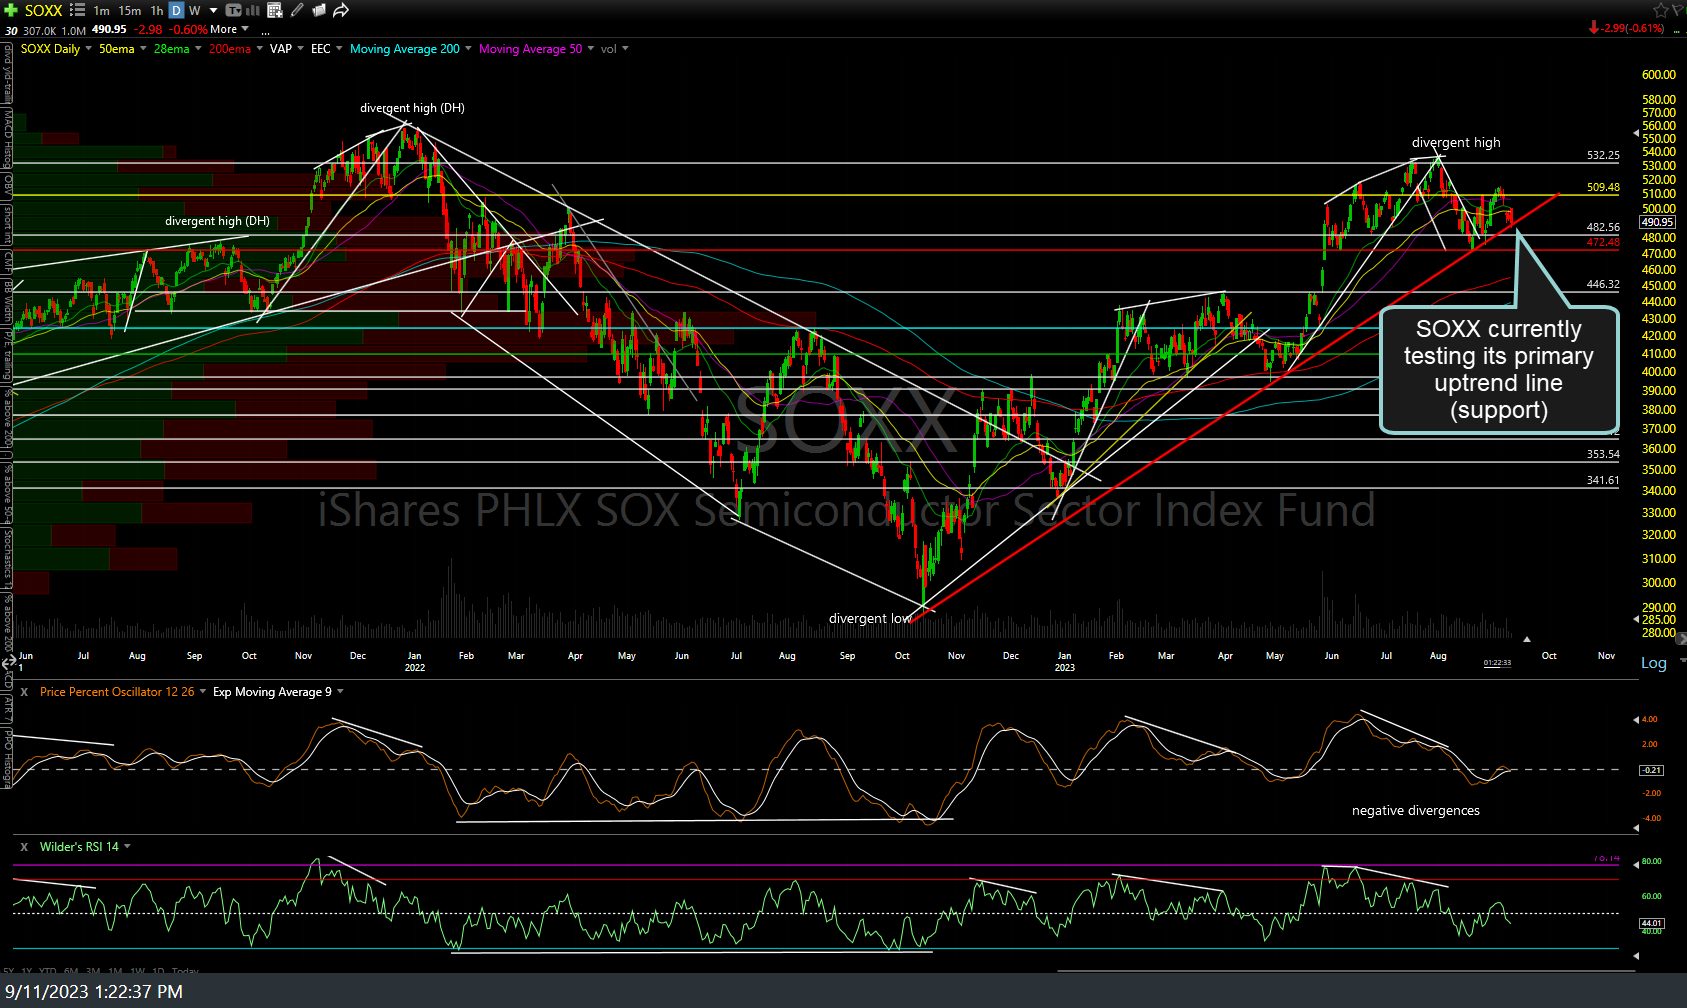
SOXX daily Sept 11th
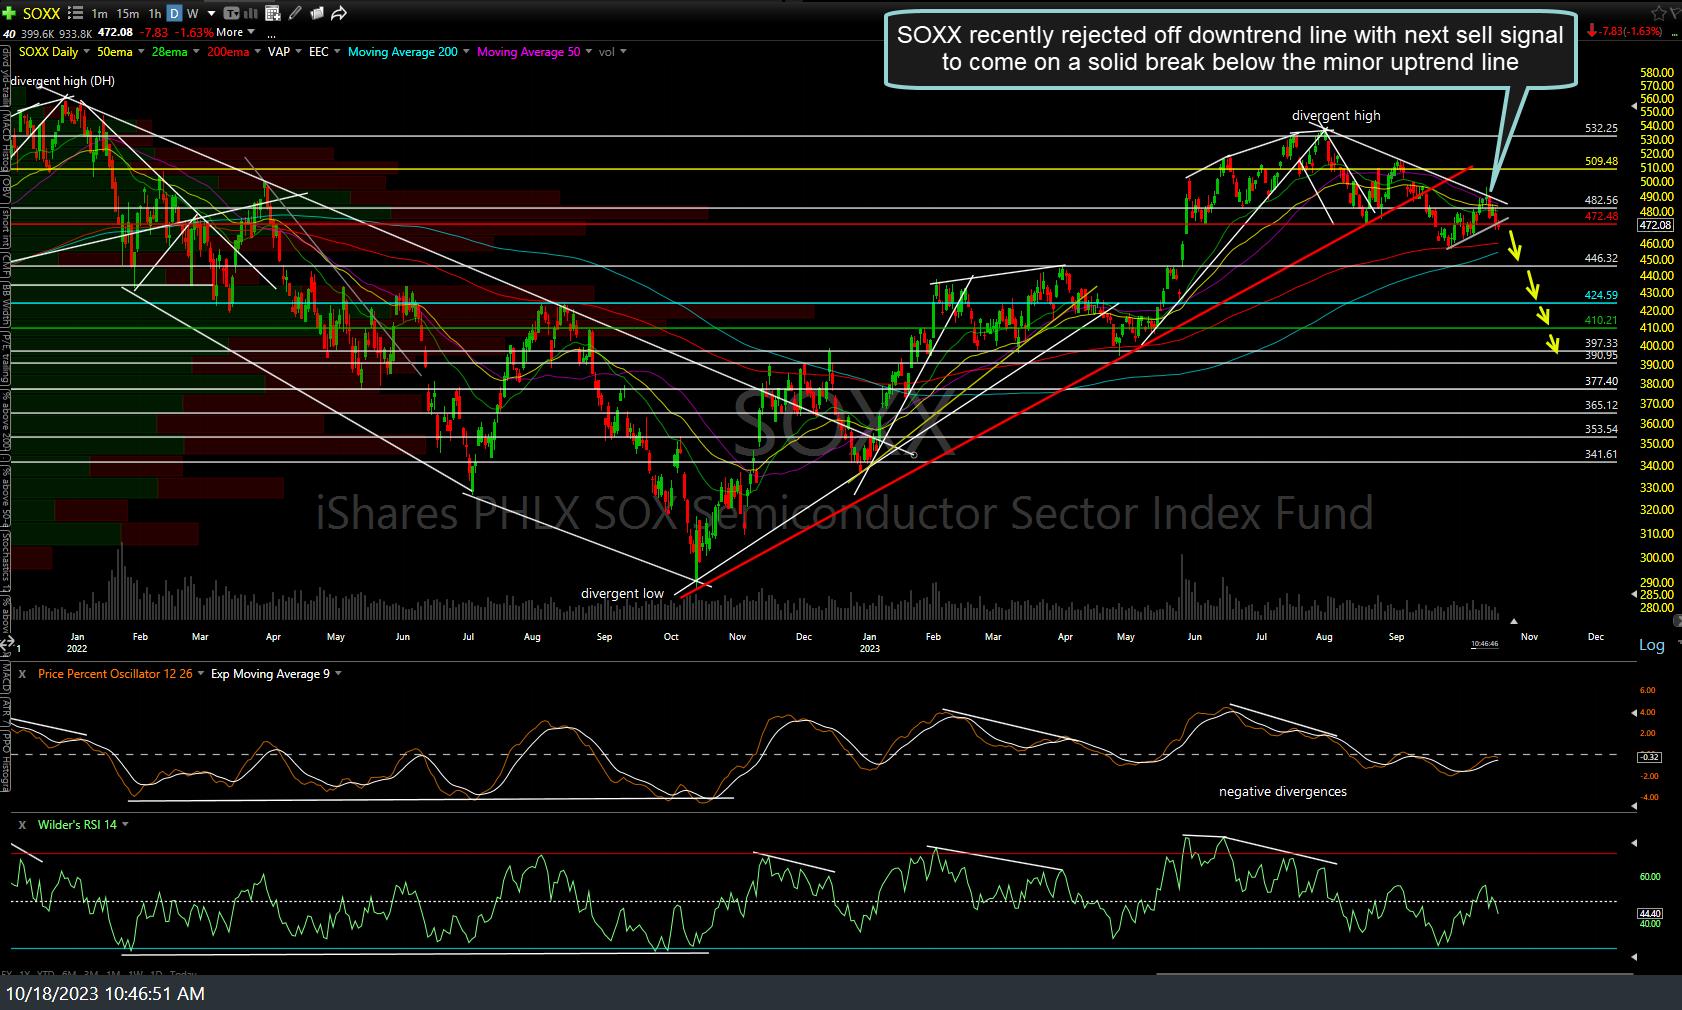
SOXX daily Oct 18th
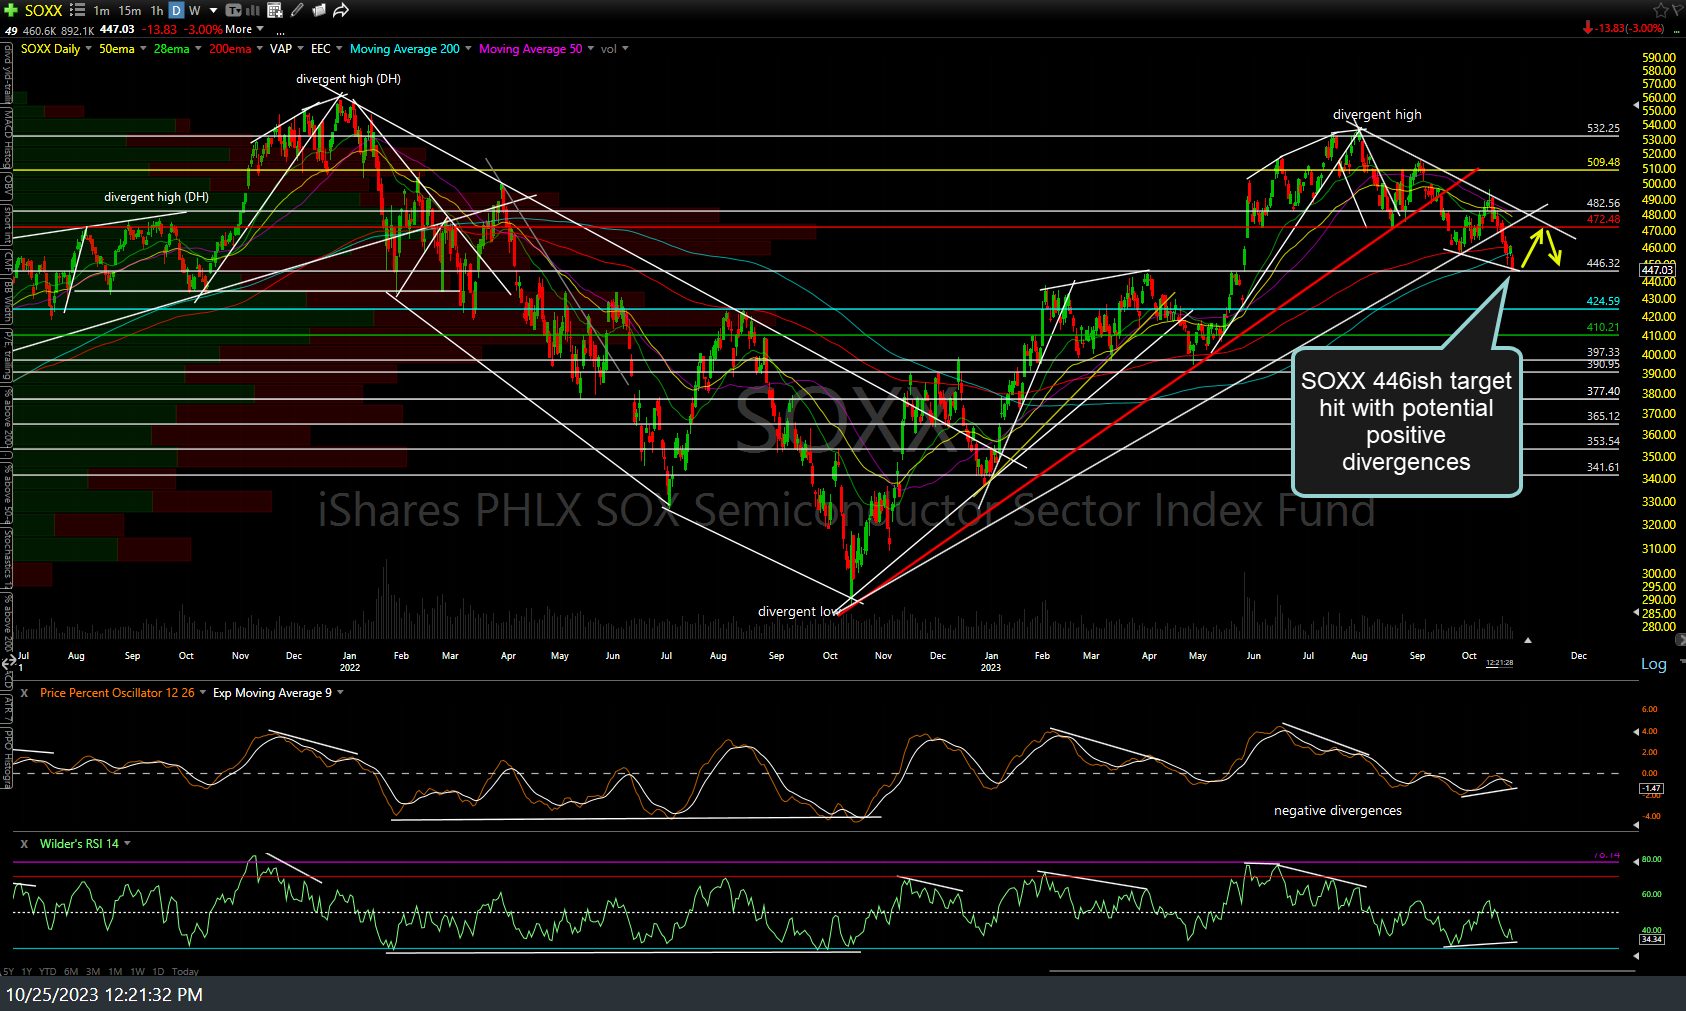
SOXX daily Oct 25th
Likewise, SOXX has also just hit T2 on the 60-minute chart with positive divergences on that intraday time frame as well. Previous (June 20th, with the initial short entry & price targets) and updated 60-minute charts below.
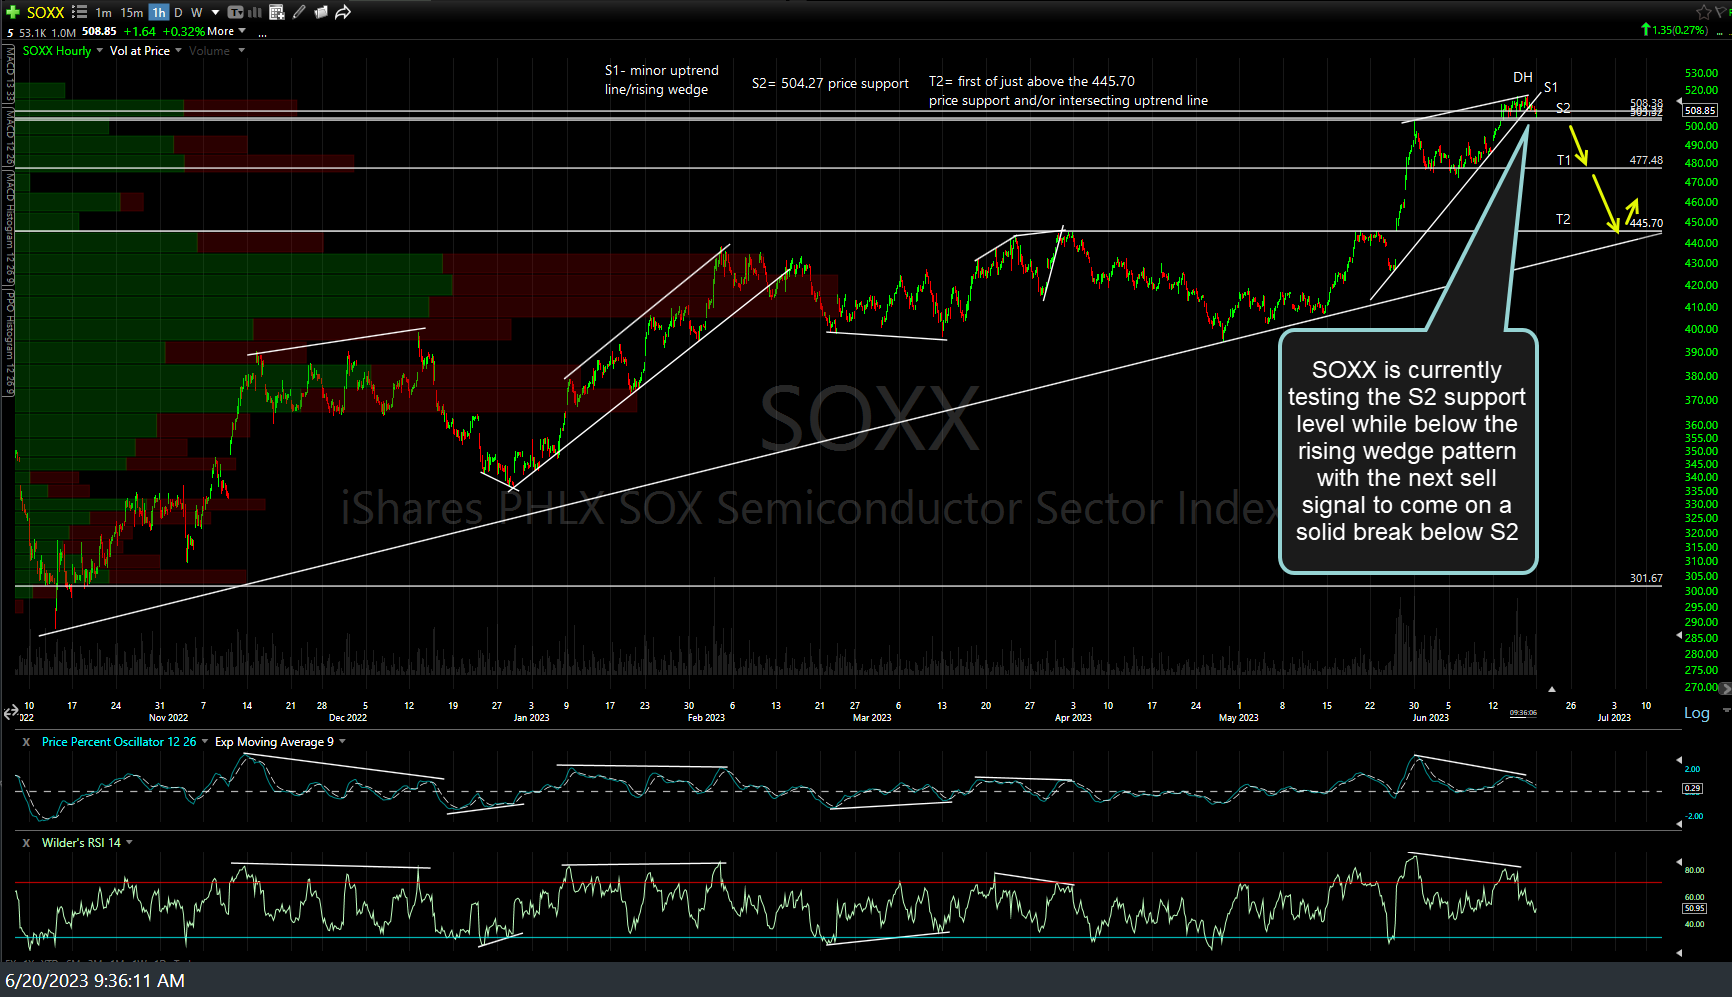
SOXX 60m June 20th
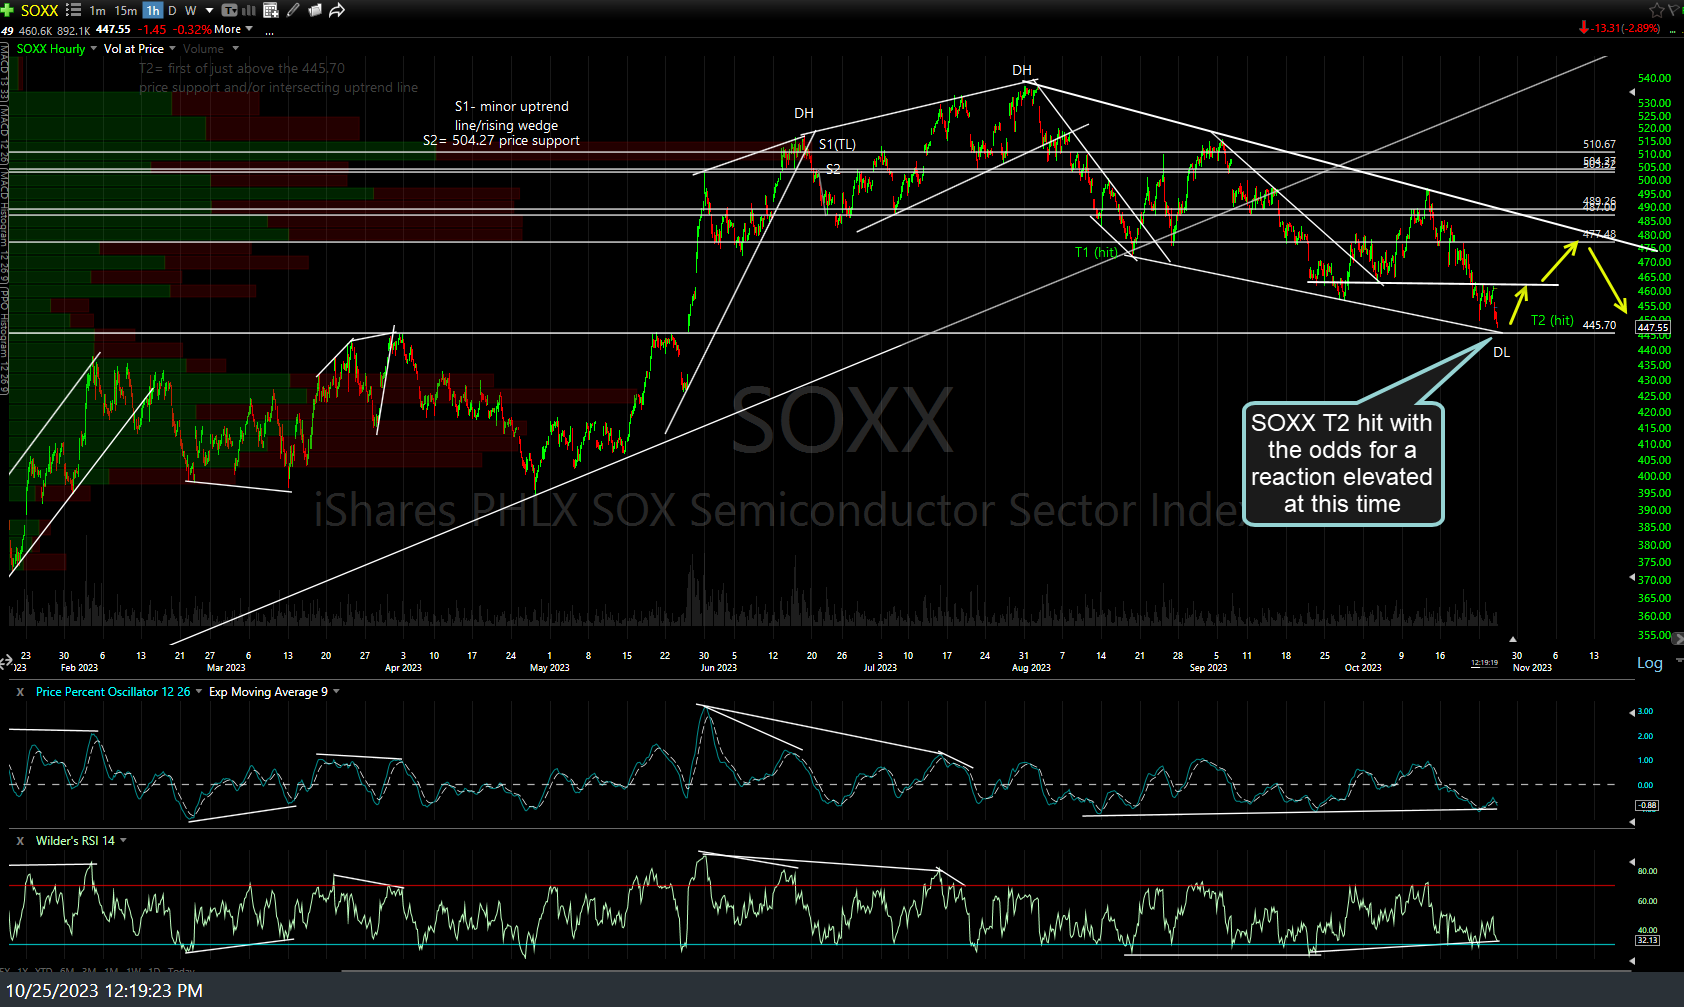
SOXX 60m Oct 25th
Note: The arrows showing the potential bounce off this support level in the charts above are the current max. bounce targets although a lot can & likely will change in the technicals over the next week or so as the remaining key tech stocks report earnings. As such, I will most likely modify where I plan to book profits on the long position that I just reversed into, assuming I’m not stopped out or decide to flip back to short before then.