
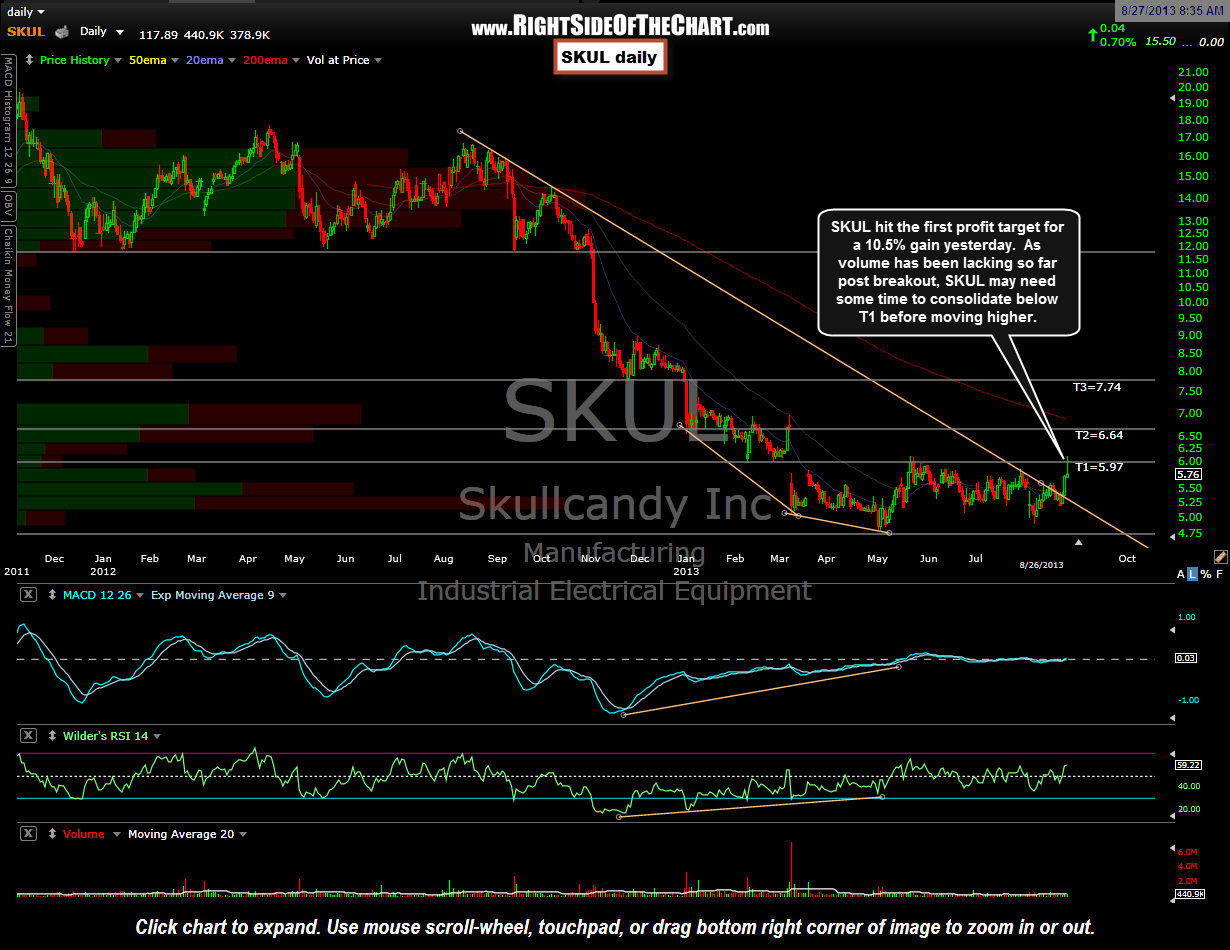
 SKUL hit the first profit target for a 10.5% gain yesterday. As volume has been lacking so far post breakout, SKUL may need some time to consolidate below T1 before moving higher.
A new follower of the site asked me about how to identify & label divergences, using the SKUL trade as an example. Below is my reply included with the chart I shared with him on Sunday:
Great question & SKUL is a good example to explain it with. First of all, just to be clear on what divergence is, an index or security can have positive divergence which is bullish or negative divergence (bearish). Simply put, positive divergence exists when the price of the security is making lower lows while the indicators or oscillators on the chart (e.g.- MACD, RSI, money flows, etc…) are making higher lows. Vice versa for negative divergence & it sounds like you understand that part so moving onto SKUL as an example:
The upper-most downtrend line has nothing to do with the positive divergence on this stock. It is the two smaller, bottom-most downtrend lines on the price which in this particular example (since there are not one, but two downtrendl lines defining the lower peak lows in price) is what is often referred to as double-divergence or double positive divergence(s). Remember, postive divergence is defined by prices making lower lows while the indicators/oscillators make higher lows so it will always be these lower price troughs, which I will often highlight with trendlines, that matter. Although I didn’t draw it on that chart, you can see from this updated chart that the MACD and RSI both made a higher low when prices made that first lower low (shown with the white trendlines & arrows). That was the first official positive divergence. Prices then went on to make another new low, albeit with a trendline that was not as steep as the previous (this showed that the strength of the downtrend or downward momentum of the stock was abating).
The upper-most downtrend line was/is probably the most important drawing on that chart is that was the line that defined the downtrend since last August. As you probably noticed, SKUL broke above it on Friday and as is commonly the case, the stock moved sharply higher due to the fact that a technical breakout was triggered. However, the divergences below were/are a very critical element of this chart pattern as downtrends can last for weeks, months or even years. The fact that we had a stock in well-defined downtrend with a quantifiable resistance level (the upper downtrend line) WITH clear positive divergences in place told us that the downside momentum was losing steam and that a trend reversal in the near future was likely. 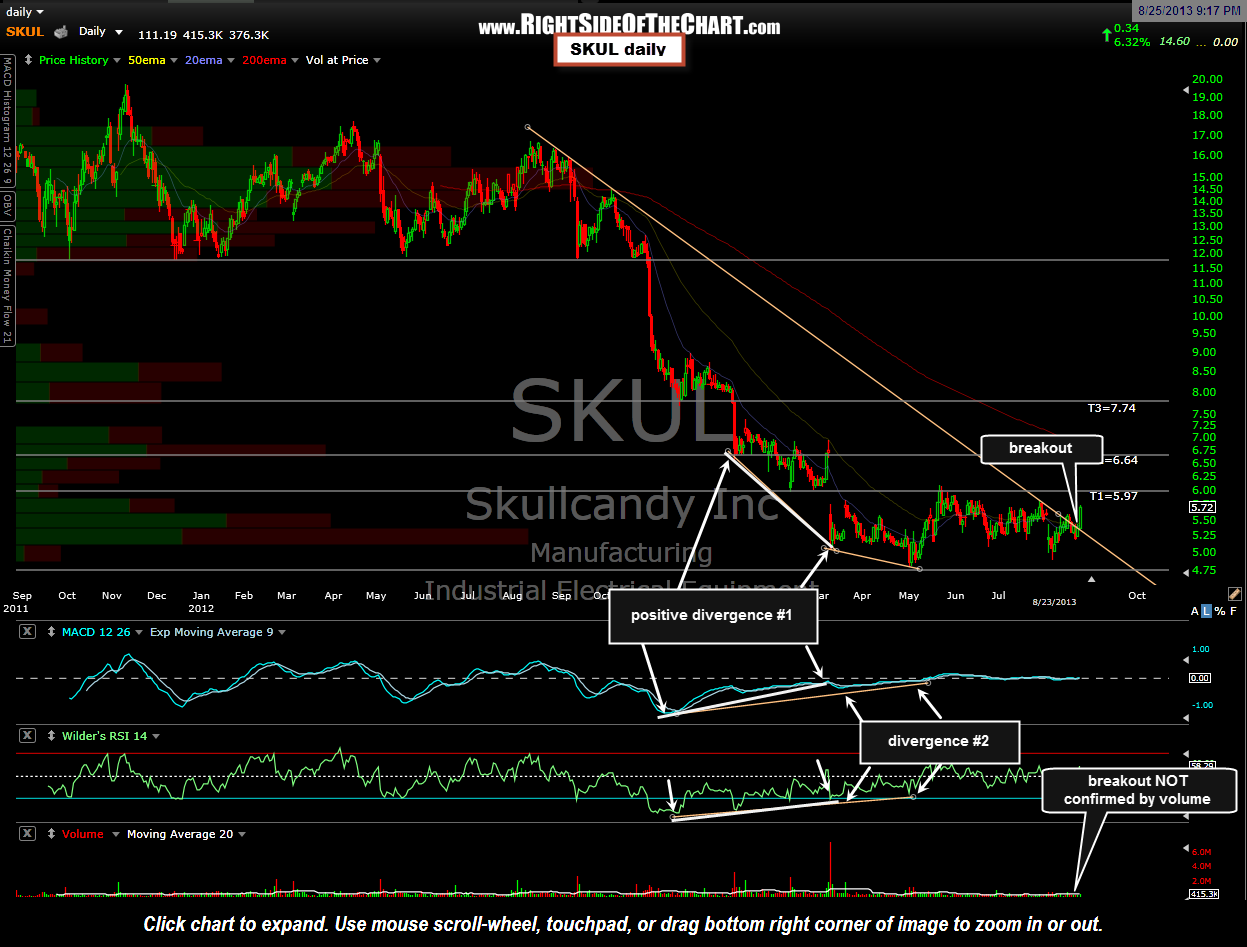 As a side note, breakouts, especially upside breakouts for long-entries, should be accompanied by above average volume (150% or more of the average volume over the last few months) in order to validate the breakout. This has been unusually low volume market lately with many breakouts happening without confirmation of above average volume but historically, bullish breakouts that are not accompanied by above average volume are more likely to fail than those that are. Also note that bearish (negative) divergences are defined by the upper-most trendlines on the price of the security. A good example is the upper-most trendline on a lot of the bearish rising wedge patterns that I post. It is the lower uptrend line that triggers a short entry as once prices move below it, they have broken below support (the uptrend line).