
SIRI (Sirius XM Holdings) will be added as an official short trade here on this break below the minor (yellow) uptrend line with the next objective alternative entry or add-on to come on a break below the bearish rising wedge pattern (white trendline) on this 60-minute chart.
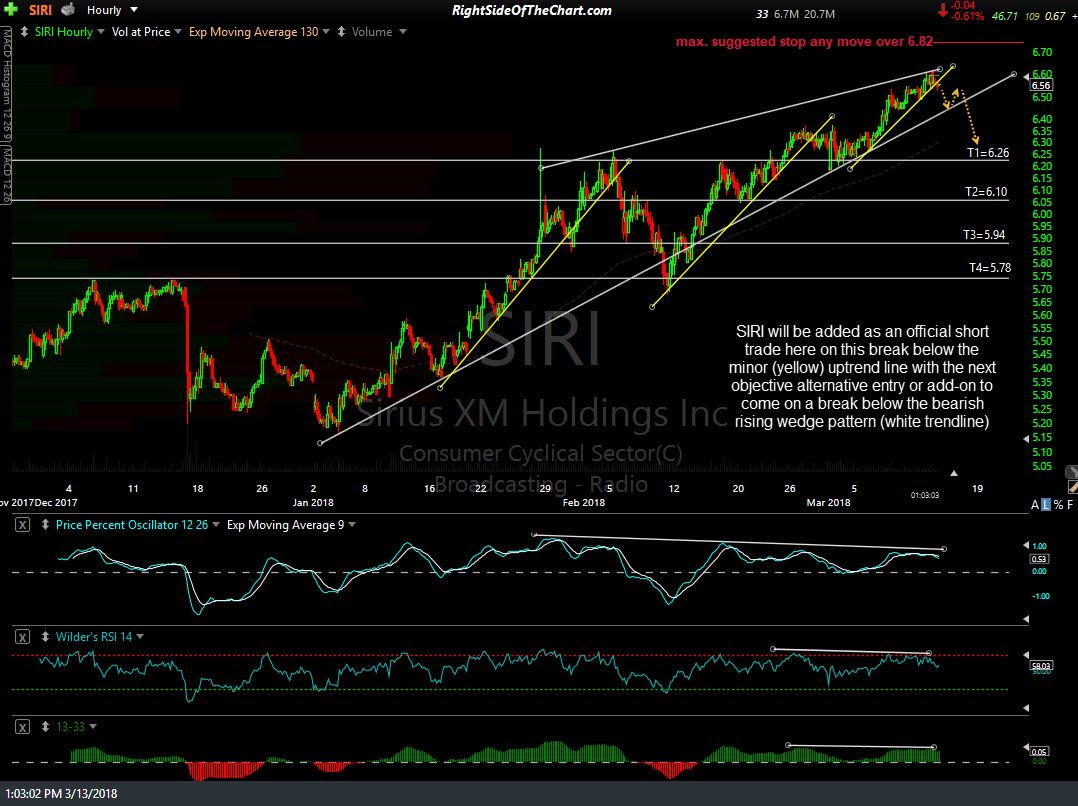
SIRI 60-min March 13th
Member @getlucky had inquired about the outlook for SIRI in the trading room yesterday. As I believe that a decent case for a reversal & correction in the stock can be made I had posted my thoughts, along with the daily chart below, on the front page yesterday. This chart highlights the pattern of extreme overbought readings & subsequent corrections in recent years, further adding to the case for a multi-week to multi-month swing short trade on the stock.
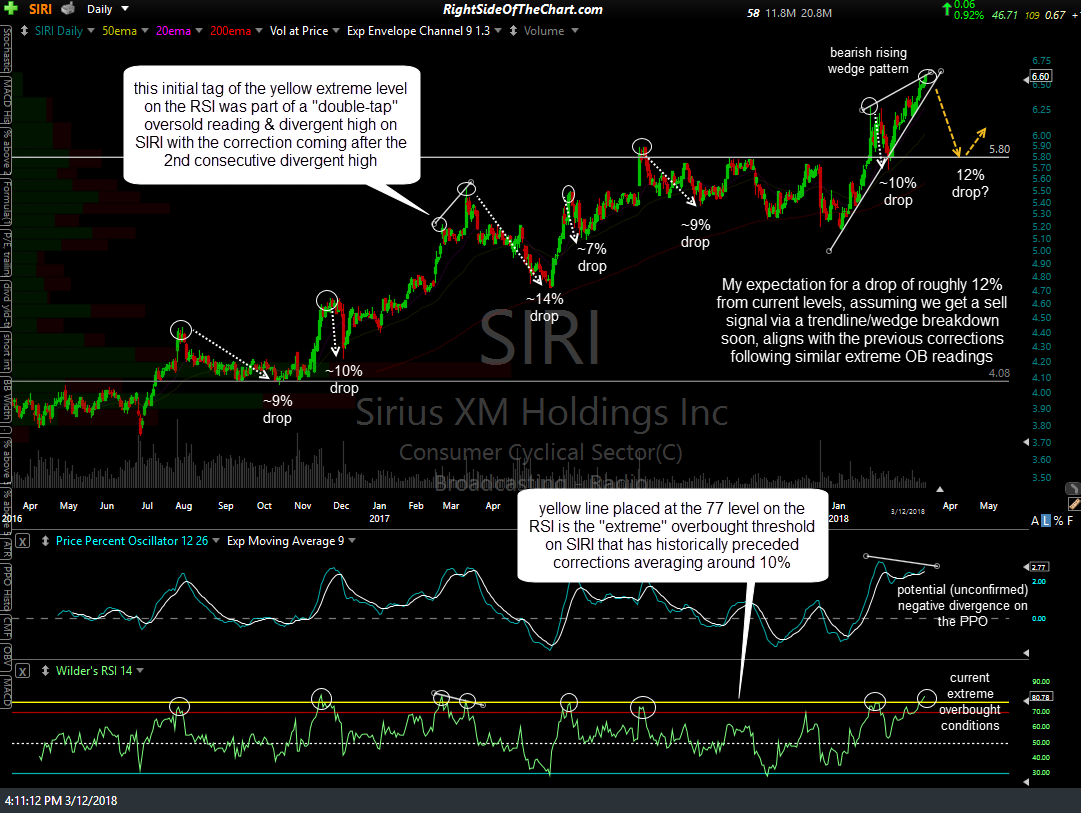
SIRI daily March 12th
The price targets for this trade, listed on the 60-minute chart at the top of the page, are T1 at 6.26, T2 at 6.10, T3 at 5.94 & T4 at 5.78. For those new to RSOTC, the reason that multiple targets are listed for most trades can be found under the Trading Related Questions subcategory on the FAQ page. The maximum suggested stop for those targeting T4 is any move above 6.82 (lower, if only targeting T1 – T3) and the suggested beta-adjusted position size for this trade is 0.80.