
Select from one of the FAQ categories below…
[nightmode]
If you have previously registered and no longer have an active membership & would like to rejoin as a Silver or Gold member in order to access premium content such as the trade ideas or access to the trading room, the process is as follows:
Log in using the same username or email address and password previously associated with your account and you should be re-directed to the membership renewal page. From there, you will be able to select your membership level (Silver or Gold) along with your choice of a monthly, quarterly or semi-annual term, with discounts applied to the longer terms. You may select any level & term as you do not need to select the same level & term of your previous membership plan.
Inactive user accounts may be removed from the site after an extended period of time so if your username or email address is not recognized while attempting to log in, you will need to create a new account. If you cancel your membership plan your username, password, account notification settings, etc.. will remain the same until/unless the account is removed after an extended period of time.
All memberships terms automatically renew for the same time period (monthly, quarterly or semi-annually) with automatic billing and can be canceled anytime (see additional Membership FAQ’s for details).
Please note: The Lifetime Rate-Lock Guarantee will only freeze your memebership rate as long as your current membership plan (same level & term) remains active. If you cancel or change your membership level and/or term, the rates in effect at that time will apply.
Right Side of the Chart (RSOTC) bridges the gap between professional-grade wealth management intelligence and independent financial freedom. Founded by veteran financial analyst and former multi-million-dollar wealth manager Randy Phinney, the platform delivers a powerful, synergistic blend of macroeconomic fundamental analysis and highly refined technical charting. We cut through the financial media noise to provide clear, data-driven market commentary across a vast global landscape, including stocks, bonds, commodities, precious metals, and cryptocurrencies.
Designed as both an accessible educational launchpad for developing traders and a sophisticated sounding board for seasoned professionals, RSOTC offers free content alongside premium services for a modest subscription fee.
How We Benefit Swing Traders & Investors
- Actionable Trade Setups: Receive high-probability ideas with clearly defined entry triggers, profit targets, and strict risk-management parameters.
- Tailored Timeframes: Trade setups generally fall into two distinct categories to match your style:
- Swing Trades: Captured via technical breakouts that act like coiled springs, with typical holding periods ranging from a few weeks to several months.
- Long-Term Trend Trades: Expected holding periods of 6 to 12+ months, using a combination of macro fundamentals and technicals to capture major primary market trends.
- While explosive “coiled spring” breakouts can often hit profit targets on day one, Right Side of the Chart is not a day trading site. We primarily focus on capturing larger structural swings rather than the small, rapid intraday profits and mandatory daily liquidations that define day trading, although day trading opportunities are presented on occasion, when market conditions are conducive.
- A Synergistic Framework: Move beyond simple indicators. Our analysis fuses broader capital flows with precise charting to ensure you are always trading with the market wind at your back.
- Extensive Media & Resources: Gain continuous market updates through regular commentary postings and an extensive, deeply insightful video library.
- Complete Transparency: Every single post, including all completed trade ideas, winners & losers, since the inception of RSOTC in January 2012, is archived and easily available for reference. Visit our Resources page to find analysis by ticker, category, or more.
- AI-Generated Video Summaries (New for 2026!): As of mid-2026, the regularly posted in-depth videos include AI-generated summaries with timestamps, making it easy to jump directly to coverage of specific stocks, ETFs, indexes, and other topics.
The Right Side Advantage: We don’t just tell you what the markets are doing; we give you the exact tools, knowledge, and structured trade ideas needed to supplement your own investment selection process and consistently position yourself on the right side of the chart.
View Our Completed Trades Here (Note: Trades that may have already hit one of the initial price targets but not the final price target or the suggested stop are only viewable to current subscribers)
Important Disclaimer: Right Side of the Chart is not a registered broker-dealer or investment advisor. All market commentary, analysis, and trade setups are shared for educational and illustrative purposes only and should not be construed as a solicitation to buy or sell any securities. Trading and investing involve substantial risk. Those associated with the site, including Randy Phinney, may or may not hold positions in the securities discussed. Please consult a professional financial advisor before making any investment decisions.
Right Side Of The Chart (RSOTC) offers both free and premium content. Free content includes access to most, but not all, analysis on the major U.S. stock indexes, educational articles and trading tips, as well as unlimited access to the archives of all past subscriber-only content* including technical analysis of precious metals, commodities, currencies & various sectors as well as closed trades. (*All posts related to closed trades are immediately released as free content with premium market analysis available to the public after a limited period of time).
These archives can be a useful tool in one’s trading to look back to study the price action of a particular stock, ETF or technical pattern during various market cycles. This allows one to view how various financial assets & securities have acted in the past and often serves as a valuable tool when trading those specific securities or price patterns going forward. Another reason for archiving every single post made on RSOTC, including all trade ideas, both winners and losers, is to provide a means for reviewing the performance of any or all trade ideas posted since the inception of Right Side Of The Chart, from the trade setup and/or entry to the completion of every trade & all of the updates posted along the way.
As RSOTC provides trading & investment ideas geared towards various trading & investing styles; from active, short-term traders; typical swing traders; trend traders; and even long-term investors, being able to view all notes & charts associated with each trade, from setup, entry, and completion (profit target hit or stopped out f0r a loss) is the best way to get a feel for the overall performance of the trade ideas shared on RSOTC that mesh with your unique trading style.
There are a few aspects of Right Side Of the Chart that I believe set it apart from most other trading & investing services:
-
- Integrity: Honest, relevant & useful analysis without misleading or deceptive claims of guaranteed success or some easy way to beat the market with minimal effort.
- Quality of Trade Ideas: No other service, be it another website, newsletter, etc.. matches the overall performance of the trade ideas that have been posted on RSOTC since the site was officially launched on Jan 1, 2012. Every trade idea ever posted, winners and losers, are indefinitely archived and easily accessed for both accountability as well as an educational resource to reference the past trading history on specific stocks, ETFs or technical patterns.
- Explicit entry points as well as explicit exit levels on all trade ideas, which are defined in well in advance. You won’t find after-the-fact, hindsight analysis here other than to point out a mistake made or lost opportunity as a educational example, as the market is an everlasting teacher. To loosely borrow on a quote from Ralph Waldo Emerson: Perfection in trading is a journey, not a destination.
- Straight-forward analysis. No fluff or extraneous “fillers”- just clear, concise & actionable trade ideas and market analysis.
- Timely and actionable trade ideas: Although a particular stock or index my be tracked for months or even years, trade ideas are often posted as close to breakout or objective entry as possible, along with clearly defined entry & exit criteria.
- Skin in the game: Professional, full-time trader since early 2007.
- Experience. Business major graduate, former career stockbroker turned full-time trader.
When developing this site, accountability and the ability to view the past results of both market analysis as well as the performance of all trade ideas posted on RSTOC was a priority. One of the driving forces that prompted me to start RSOTC was the fact that in all my years of trading, I have yet to come across a single trading or investing service that provides a means to clearly & accurately view all former market commentary and trade ideas. Unfortunately, deceptive and outright false claims of stellar performance abound in the investment & trading world, especially in the less-regulated cyber-sphere.
Since the inception of Right Side of the Chart, every single post that has been published, e.g.- every market commentary, including all charts as well as all trade setups & the follow-up charts and commentary associated with each trade, are archived indefinitely and are easily accessible to both subscribers as well as the general public.
All trades, winners and losers, as well as all market commentary, charts or any post made since RSOTC was officially launched on January 1, 2012 is available in its original, *unedited form. (*published posts are occasionally edited after the original publication only for grammatical errors and typos or related errors such as mistakenly attaching the wrong chart, as these types of errors are somewhat common as due to the time-sensitive nature of many trade ideas & market updates, commentary & charts are often composed & published asap, then proofread for typos after-the-fact with typographical errors often pointed out by followers of the site…thank you!).
There are several ways to review the performance of trade ideas and market analysis on RSOTC:
- The Completed Trades Archives. On the menu bar near the top of the site, hover over the Trading & Investing Ideas category. From the sub-menu that pops up below, select Ccompleted Trades in order to view all completed trades, both long & short as well as the typical swing trade ideas along with the Long-term Trade (investments) ideas. From there, all trades can be viewed in reverse chronological order (most recent first) and you can even select to view trades by calendar year. Another option is to click on any of the ticker symbols in the “symbol cloud” at the top of the page. It is highly recommended to watch the Site Navigation and Tips video in order to take full advantage of the features available on RSTOC and most efficiently access the archived trade ideas and commentary.
- Ticker Symbol Tags. Every post that discusses a particular stock, ETF, index or other financial instrument is assigned one or more Tags, which allow that post to be easily referenced in the future. Symbol tags can be referenced at the top of each Trade Category page (e.g.- Long Trade Setups, Active Short Trades, Growth & Income Trades, etc..). The tag or tags assigned to each post can also be found at the lower right-hand corner of that post. Finally, the “Select Ticker” dropdown box in the right-hand sidebar of the main page of the site can be used to quickly reference any symbol tag. All tags are hyperlinks which, when clicked, will bring up all previous posts associated with that symbol or “tag”. Note: When clicking on a tag within the tag cloud of a specific trade category, such as the Active Trades, only the posts on that ticker symbol associated with the current trade will be shown. This is covered in the Site Navigation & Tips video.
- Using Categories. Let’s say that your main interest lies in trading the ES mini futures or some other broad market derivatives or maybe you prefer to trade gold, silver, or various commodities. In addition to the symbol tagging system, each post is assigned one or more categories. Categories work in a similar fashion to the symbol tags where each post is assigned to one or more categories with the category(ies) appearing just below the title of each post (to the right of the date box). As with tags, you can simply click on the category that you are interested in viewing as these are also hyperlinks. The various categories can also be easily references from the main menu at the top of each page. Selecting the Gold & Commodities category will bring up all posts related to gold & commodities including gold & silver mining stocks.
No. Right Side Of The Chart offer both free & premium content. The free content is available to all and does not require registration with RSOTC. Details on the free vs. premium content can be viewed by clicking this link.
Both the Gold & Silver membership terms have increasing discounts for the longer terms compared to the monthly rates when annualized (i.e.- assuming 12 months of access) as follows:
GOLD:
Monthly: $79.00
Quarterly: $199.00 (16% discount)
Semi-annual: $349.00 (26% discount)
Yearly: $599.00 (37% discount)
SILVER:
Monthly: $39.00
Quarterly: $99.00 (15% discount)
Semi-annual: $179.00 (24% discount)
Yearly: $299.00 (36% discount)
The next scheduled renewal date for your membership can be found on the right side of the Login Welcome page, which can be accessed by clicking here.
Note: You must already be logged in before clicking the link above to be taken to the Login Welcome page.
That was a question posted by a member of the site on Oct 17, 2016 and this was my reply:
If you wish to change the credit card associated with your membership subscription or to update your credit card expiration date, please click here to visit our Billing Update page.
Right Side Of The Chart provides you with the ability to cancel any future renewals of your membership at anytime. Upon cancellation, you will continue to have full access to the site for the remainder of your current membership term. Full or pro-rated refunds are not provided upon the cancellation of your recurring billing period.
To cancel your membership, please make sure that you are logged in and then click here to go to our billing cancellation page.
Should you have any questions or issues with the cancellation process, click here to contact us.
Nearly all credit & debit cards, including Visa, MasterCard, American Express, JCB, Discover, and Diners Club from anywhere in the world are accepted. Gift & pre-paid cards from these types of cards are also accepted as well. While PayPal is currently not available as a payment option for recurring membership plans with various terms, PayPal can be used for an annual (1 year), non-renewing Gold or Silver membership. Please contact us to request the PayPal sign-up form along with your preference of a Silver or Gold Level membership.
If you would prefer to pay by check, please contact us & we will provide mailing & payment instructions. Other payment options such as Bitcoin, Apple Pay, Android Pay, and China’s Alipay are not currently offered but will be considered if the demand is there. Please let us know if you have a preference to any one of these or any other payment options.
Many of the trade ideas on RSOTC list multiple price targets to accommodate various trading styles. For example, a very active trader might only target T1 (the first profit target) looking to book a quick, relatively modest 5% on a trade that is expected to last anywhere from a couple of days to less than two weeks while a typical swing trader who is bullish on both the specific stock as well as the broad market in the short & intermediate-term might prefer to hold out for T3 for double-digit gains and an expected holding period of a few weeks to a couple of months, possibly booking partial profits or even reversing the trade (short to long for a quick bounce) at T2.
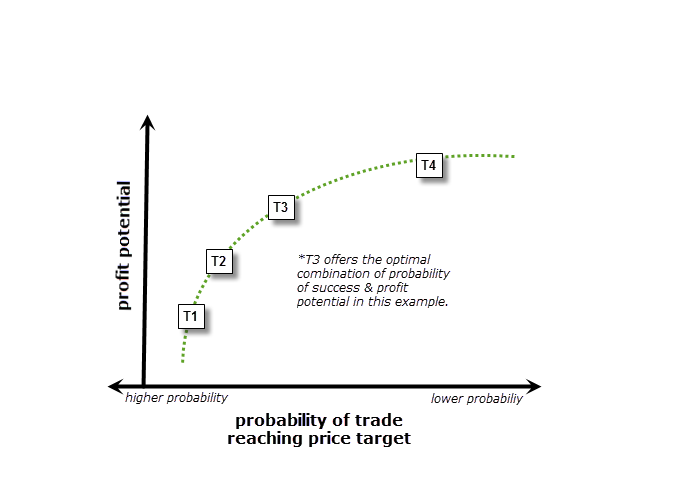 Although all profit targets posted on the trade ideas have a good chance of being hit based on my analysis of the chart, I view targets this way: Logically, the lower the target (numerically, e.g.- T1, T2, etc…) the better chance it has of being hit, as that level is closest to the current price. However, the final target, although having a lower probability of being hit, still has a relatively good chance based on my interpretation of the technicals along with other factors such as the outlook for the broad market, current sentiment & short-interest measures, etc…
Typically, the final target is set at a level in which the R/R is no longer clearly favorable to remain in the trade and therefore I will usually book profits on any and all shares that I might still own. A preferred target, which is often mentioned on a trade, is the level where the current “sweet spot” on the R/R curve is at the time, as illustrated in this example (chart).
Multiple price targets are often used for trade ideas to accommodate various trading styles. For example, very active traders who prefer to book relatively shallow, quick profits & move on to the next trade my decide to book full profits at the first target while typical swing traders with holding periods measured in weeks or months may target one or more of the higher targets, possibly booking partial profits along the way as the early targets are hit.
Some traders might opt to book partial profits as certain targets are hit while very active traders might even micro-manage their trades around these levels (e.g.- reversing a trade from long to short at a target where a reaction is highly likely, then recycling back into the original direction of the trade either on the pullback or once that target level is cleared.)
Whatever your individual trading style is, the important thing is to have a trading plan in place for each trade which includes: How much capital you want to commit to the position; Whether you plan to scale into the position (average in) or take a full position upon your entry trigger; What your entry trigger will be; Your profit target(s) if the trade is successful as well as your stop level(s), if the trade does not pan out.
also see: How Are Price Targets Determined?
Although I personally trade many of the trade ideas posted on Right Side of the Chart, I do not take every trade for numerous reasons. For example, at times, I might already be fully invested or at my ideal market exposure level when I come across some new trade ideas which are posted on the site. I may already have my maximum long or short exposure or target exposure to a specific sector at the time a new trade idea is posted, in which I’ll pass on as to avoid over-exposure to that sector or industry. I also strive to provide the most attractive trade setups, long and short, regardless of my current market bias (which I always do my best to make clear). Therefore, while I might be bullish at the time & shying away from short exposure, someone who is bearish just might profit on a short trade that I posted as a trade idea but chose not to personally take the trade.
Another instance where I’ll pass on a trade idea that triggers an entry would be if I plan to be away from my desk in the near future, such as just before a vacation. Additionally, many sector and broad market ETF trade ideas are posted on RSOTC. As an experienced trader, I will often chose to trade the most bullish or bearish stocks within a particular sector that stands out at the time, preferring to trade long (short) the most bullish (bearish) stocks within a particular sector or industry in lieu of trading the associated ETF. However, as many traders prefer the diversity and convenience of trading ETFs over individual stocks, ETFs are often posted as trade ideas.
Therefore, I may or may not have a position in any of the trade ideas posted on the site although I would never post a setup that I don’t believe has a good chance of being successful. I strive to identify and share the most promising trade setups with clearly defined chart patterns and above average risk/reward profiles, both long and short, regardless of the current trend or my own personal market bias. With that being said, it is normal to expect more long trade setups when the near-term & intermediate-term trend or outlook for the market is bullish and vice versa with more short trade ideas during a downtrend or at times when it appears that a correction is likely.
The amount of capital one needs to begin trading or investing varies widely depending on numerous factors; Are you just interested in learning the basics or enhancing your trading & investing skills or do you plan to trade full time as your primary source of income? If so, how much do you need to withdrawal from your trading account for living expenses? What are your expected annual returns and how consistent to you expect those returns to be? Are you looking to trade to supplement another source of income, such as a pension or social security or are you still early in your working career?
The decision to embark on a career of trading full-time for a living should be carefully thought out and at that, only when one has a high degree of confidence in their abilities to consistently generate more than enough income needed in all market conditions such as bull markets, bear markets, and deer (sideways) markets. Typically, achieving such a level of trading proficiency takes years and is certainly not something that can be learned by attending a few seminars or subscribing to a newsletter or any other paid service, including this one. Unfortunately, the answer to the question about how much trading capital one needs to embark on a full-time trading career can not be answered here nor can Right Side of the Chart offer any type of trading, investing or career advice. The answer to that question can only be answered by the person asking it and only then after they have enough experience in order to ask themselves all of the pertinent questions associated with their own unique circumstances.
For those new to trading or investing, one viable option to avoid the common pitfall of losing most or all of your trading/investing capital during the early stages of the never-ending learning curve would be to start out paper trading. Most brokerage firms offer paper trading whereby you are able to trade securities (stocks, ETFs, options, & futures) without using real money. One potential benefit to doing so would be to allow someone new to trading or investing to hone & refine their own unique trading style (e.g.-day trader, swing trader, trend trader, investor, etc..) without risking any real money. Inquire with your brokerage firm about paper trading and consider consulting with a licensed stockbroker or Registered Investment Advisor before making any investment decisions that exceed your experience and/or comfort level. Please make sure to read our disclaimer.
Although there are no guarantees in trading/investing, Right Side Of The Chart (RSOTC) makes every effort to explain the reasoning behind each trade idea, often providing additional information and considerations such as reducing position sizing on more volatile, higher risk trades; proper diversification among various sectors; helping to identify times when it might be beneficial to keep trading light, such as during periods where the market is likely to consolidate (i.e.- chop around without a clear direction); etc…
Many of the concepts and analysis published on Trade ideas on RSTOC may be useful to both short-term, active traders as well as longer-term investors utilizing a more hands-off, part-time approach to managing their trades or investments. Although the majority of the trade ideas shared on the site are intended as swing trades with typical holding periods ranging from several days to several months, RSOTC also offers a separate category of Long-Term Trade Ideas geared towards longer-term swing traders, trend traders & investors. Long-term Trades are trade or investment ideas that have the potential for significant returns over a longer-term period, typically several months or more. This category of trade ideas might be useful for the longer-term swing trader or investor looking for investment ideas to supplement their existing portfolio and prefers a less active, more hands-off approach to investing.
Please be aware that all content on this site is provided for informational and educational purposes. Furthermore, information contained herein reflects the opinions of its author and is provided for discussion purposes only. Under no circumstances does this information represent a recommendation to buy or sell securities, nor should it be construed as investment advice. Right Side of the Chart, LLC and Randy Phinney are NOT Registered Investments Advisors nor licensed or registered with any federal or state securities regulatory agency. Click here to view the full disclaimer.
originally posted February 17, 2012:
Beta-Adjusted Position Sizing is a term that I use for to process of determining how much trading capital to deploy to each of my trades. Beta is the term used in the financial markets to compare the price fluctuations of a security (stock, ETF, mutual fund, etc..) against it’s benchmark. The most common benchmark used is the S&P500 although a stock’s beta can be measured against any specific index or benchmark (e.g. comparing SPG (Simon Property Group, a large REIT, to the DJ REIT sector). However, for the purpose of determining my position size, I typically use the broad market (S&P 500 Index).
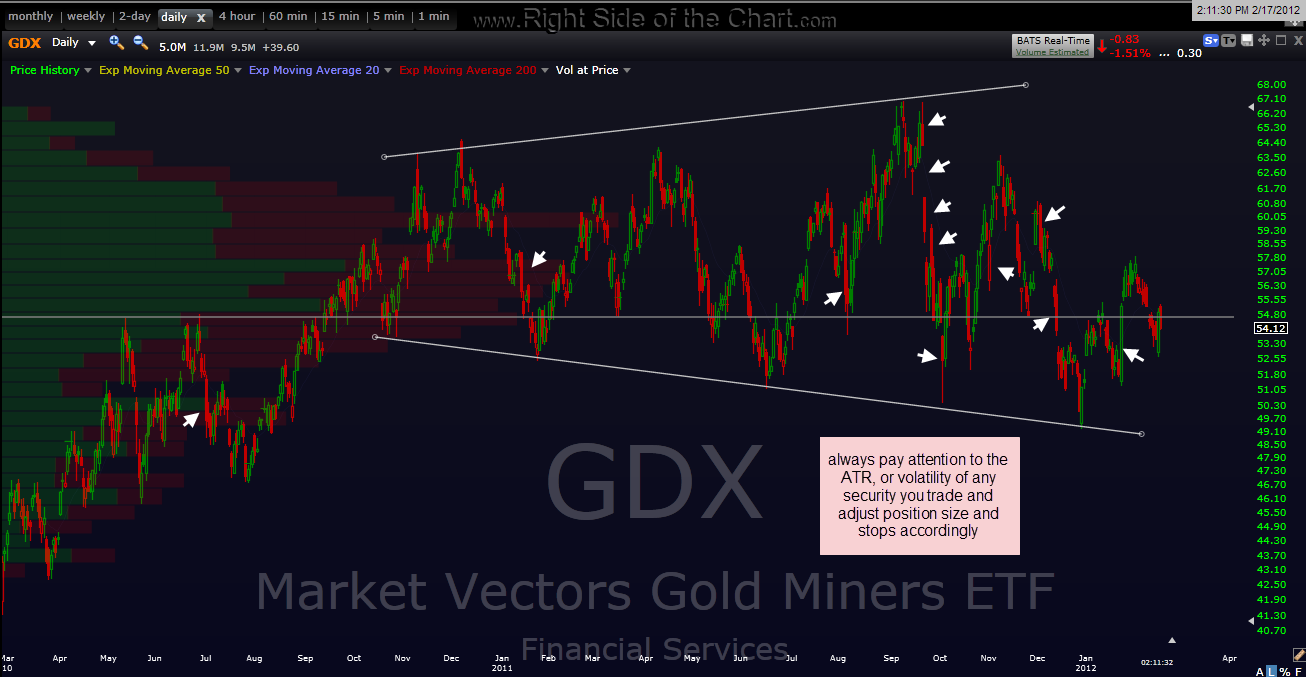 Take GDX for example. Yesterday I had mentioned that fact that I completely disregard the big bullish engulfing candlestick put in on the daily chart since engulfing candlesticks are very common with the big price swings in GDX. If you click to expand this chart, you will notice that the day to day swings are much larger than the daily moves in the SPX. This gives GDX (forget about any correlations or lack thereof to the SPX for this purpose) a very high beta.
Another tool to use is the Average True Range (ATR) indicator on your charts but honestly, you should just be able to eyeball a chart and see how volatile any stock or ETF has traded in the past. Most importantly, if you are looking at a stock in a pattern like a bullish falling wedge, you must realize that prices continue to be compressed as the wedge forms so don’t assume that lower volatility will continue going forward. On the contrary, falling wedge patterns are like coiled springs and once they trigger (break-out) then volatility often increases very sharply, very fast.
I don’t use any hard formula when determining my position size, maybe because I’ve been trading and investing for so many years that it becomes an automatic, especially as I often trade many of the same stocks repeatedly over time. However, as a rookie trader or investor, I believe that it is critical to your success that you adjust your position size according to both the potential risk AND return (which ALWAYS go hand in hand).
For example, one of my recent trades was the CVM long set-up that was posted on Jan 12th (2012) while just breaking out of a nice falling channel. CVM was a .34c stock back then which rule #1, DON’T USE FULL POSITION SIZES FOR PENNY STOCKS (sorry to yell, just wanted to make that clear). The top of my final target zone was at .48c, or about 41% higher. This trade hit that level just 3 days later (it actually stopped and reversed at .49c). However, if that trade didn’t work out and the breakout failed, I would not have been surprised to see it drop 10%+ in no time flat. Therefore, on a trade like that, being a low-priced stock with a volatile trading history, if you would normally put, say $10k into a SPY or GE trade, then you might only want to put $2500-$3k (maybe even less) into CVM. Think of it this way, if you are looking at a potential gain of 40% on the trade, then $3k x 40% = $1,200 profit. That is equivalent to a 12% gain on your $10k SPY trade (and when was the last time the SPY when up 12% in 3 days?)
Also make sure to beta-adjust your ETF trades, accounting not only for any leverage (2x or 3x long or short ETF’s) but also the sector. That NUGT short that I have on right now is not only leveraged 3x against the gold miner sector but that sector itself is one of the most volatile sectors out there to boot. Therefore, I not only lower the position size that I take on the trade but I also widen my stops considerably to account for both the leverage as well as the inherent volatility in the sector. On a final note, it works the other way too. For example, if I were to trade the TLT (long-term US gov’t bond ETF), then I might use about 1 1/2 times my usually position size in order to account for the lower than usual expected gains and volatility.
That’s a great question Bibiano. In fact, I’m going to add it to the FAQ page. Technically, yes, I do monitor oil, gold, nat gas, biotechs & just about every other key index, sector & commodity on a consistent basis however, I don’t always post updates on each of those on a regular basis.
The financial markets are a compilation of US & global stocks, commodities, currencies, precious metals, etc.., all of which are inter-related to varying degrees with one particular asset class often affected by what’s occurring in another asset class (e.g- the correlation between oil or gold & the US dollar or other key currencies). While I spend the bulk of my day reviewing the charts & price action of most major stock indices, currencies, various type of bonds, commodities, etc…, I don’t always post consistent updates on all of them.
First & foremost, there just isn’t enough time in the day to do so but more importantly, I strive to keep the analysis & trade ideas on RSOTC as streamlined and as timely as possible. If I were post regular updates on, gold, for example, there’s a good chance that my analysis on gold would become somewhat diluted. For example, the less-active swing traders & investors that might just scan the headlines of my front page posts might miss the posts where I start to highlight some key developments in the precious metals.
As such, I might suddenly increase my analysis & posting of trade ideas on gold, silver & the miners when it appears that the sector may be about to present some lucrative trading opportunities. Likewise, once the bulk of the move that I was expecting has played out & the R/R is no longer very compelling, such as I recently posted a couple of weeks ago when I closed out the short trades on the gold & silver mining stocks (which have since grinded around in a sideways, nearly impossible to trade range, going nowhere since then), I will share my thoughts as to the fact that I either don’t have a good read on the next direction of the sector or simply don’t think the R/R is attractive to remain long or short and simply move on to the next trading opportunity that looks compelling.
EVERY asset class, be it a stock index, sector, commodity, currency, etc… goes through periods that are very conducive to swing or trend trading as well as periods where the current or next direction is simply very unclear. including impossible to trade consolidation periods that can last for months or sometimes years. I will watch a particular sector or stock for weeks, months & even years, waiting patiently for the charts to clearly start setting up for a likely bullish or bearish trend/trading opportunity. It is not uncommon for me to post very frequent updates on a particular sector for days, weeks or months on end then relatively abruptly, after closing out all my positions once the R/R for trading that sector no longer looks compelling, I might stop posting updates until the next trading opp in that sector begins to materialize.
With that being said, one of the benefits offered to Gold members of the site is they can request my opinion on a stock, sector, commodity, international stock index, etc… whenever they like. I’ll typically reply with my thoughts, as well as the conviction (or lack thereof) of my opinion, along with a chart(s) supporting my analysis. Such requests can be made publicly via the trading room (the preferred option as others might benefit from the discussion) or via the private messaging feature. Hope this helps & as always, I welcome feedback & suggestions to the site & will do my best to accommodate the requests from members.