
SLV (Silver ETF) is at the top of a resistance zone while overbought & with potential divergences in place (on the daily time frame, this is a 2-day period chart).
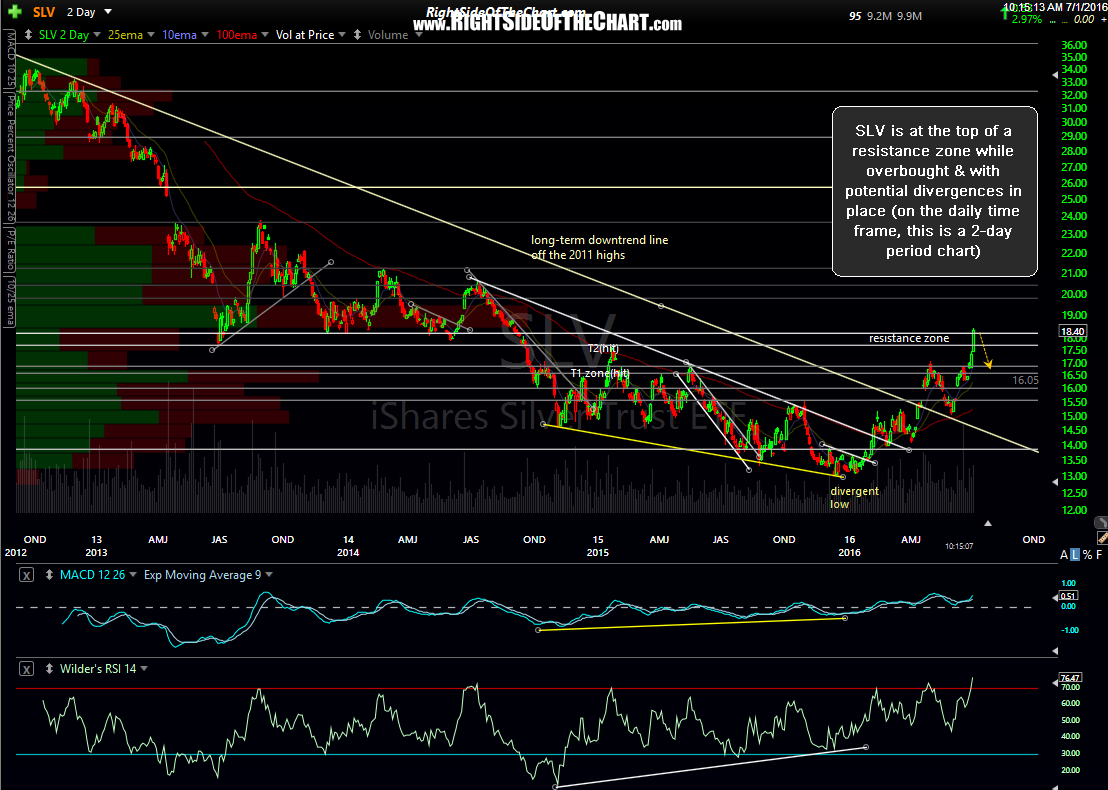
SLV 2-day period July 1st
$SILVER (spot silver prices) closed right around the key 18.80-19.00 resistance level yesterday while also very overbought & with potential (although not yet confirmed) negative divergences forming with both the MACD & RSI making lower highs while silver prices make higher highs. Although the longer-term outlook for silver remains clearly bullish, the odds for a reaction (pullback and/or consolidation) at this time are quite elevated.
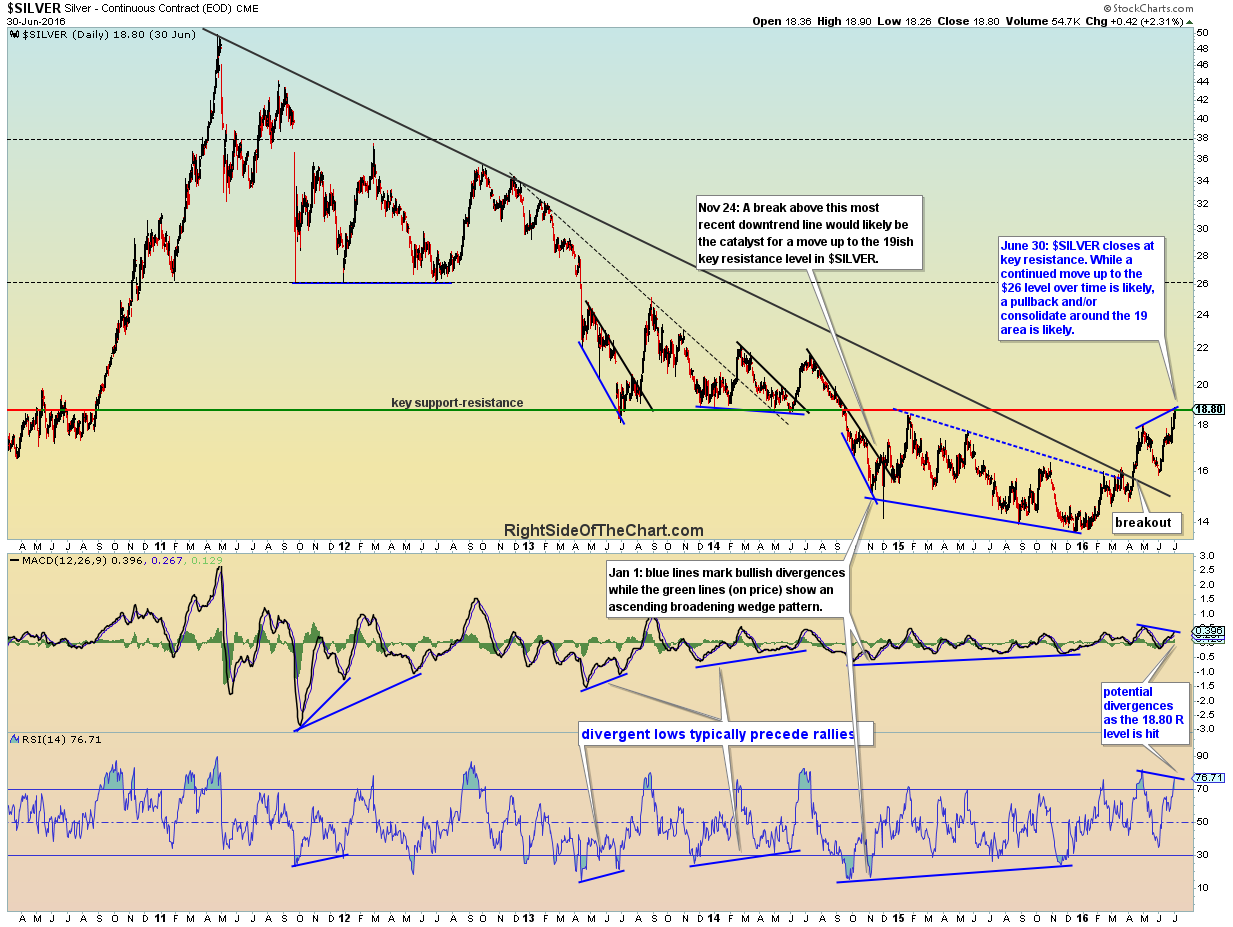
$SILVER daily June 30th close
While we don’t have any sell signals as of yet, I will be on the lookout for any time of bearish reversal such as a 2-day candlestick pattern, a bearish engulfing candlestick & move back below yesterday’s highs in SLV, etc… for a possible short entry on silver and/or the gold & silver mining stocks (as I had recently highlight the fact that GDX is also at significant resistance with the charts also reflecting a likely correction).