
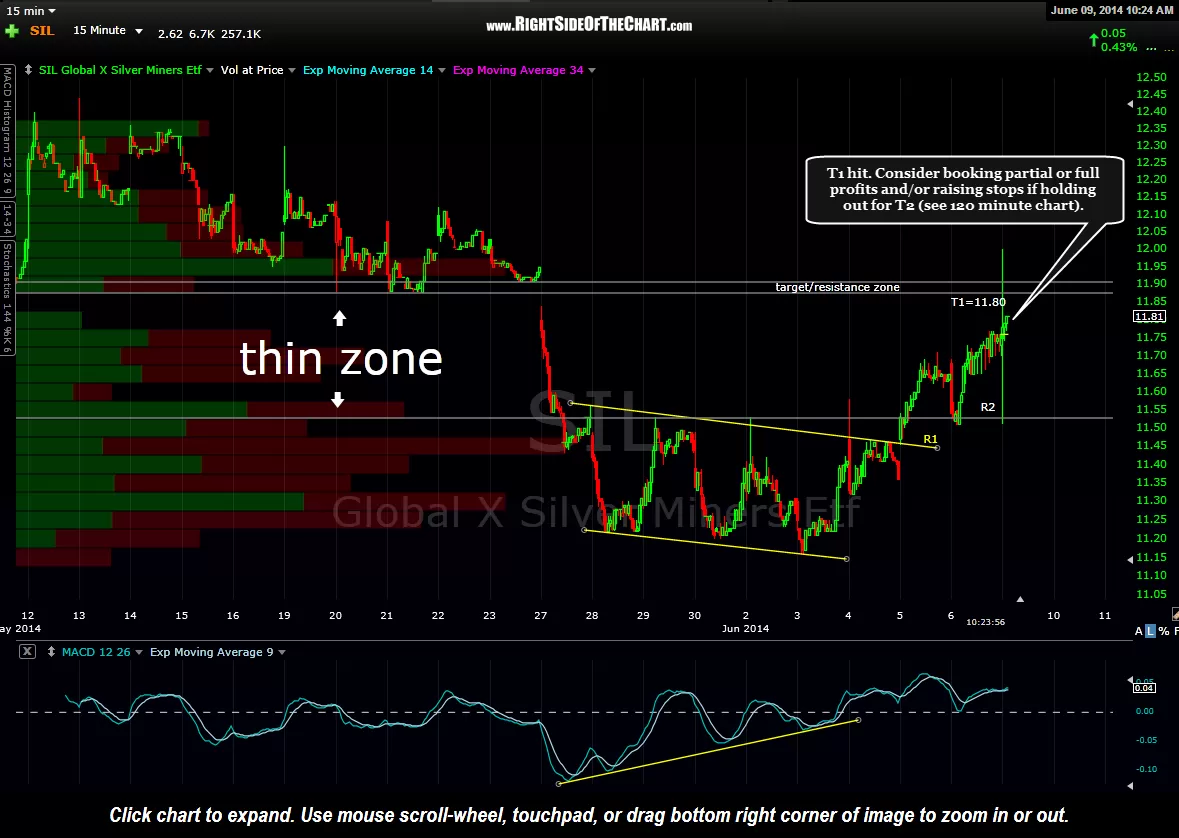
SIL (Silver Miners ETF) has hit the first price target for a relatively modest but quick 2.9% gain. Remember that the expected gains & holding period for a swing trade are commensurate with the time frame that the trade is based off. Swing trade candidates based of the daily charts will typically have gain potential measured in the low to mid double digits (percentage-wise) with holding periods of a couple of weeks to several months. This SIL trade was based off the 15 minute period chart. With 6.5 hours in a trading day, the 15 minute chart is 26 times smaller (6.5 hrs/15 minutes=26 periods) in scale than a daily chart, hence, the duration of the trades and the percentage gains will be much smaller. While part-time or longer-term swing traders might opt to pass on short-term trades based off the intraday chart, the benefit to more active traders that do trade short-term patterns is what I’ve referred to in the past as velocity (see the underlined paragraph in this link for velocity explained). In the case of this SIL trade, the trading capital & profits from that relatively modest 2.9% gain, which took just two trading sessions (SIL broke out on Thursday morning) is already available to deploy into the next trading opportunity.
-

- SIL 15 minute June 9th
-
- SIL 120 minute June 9th
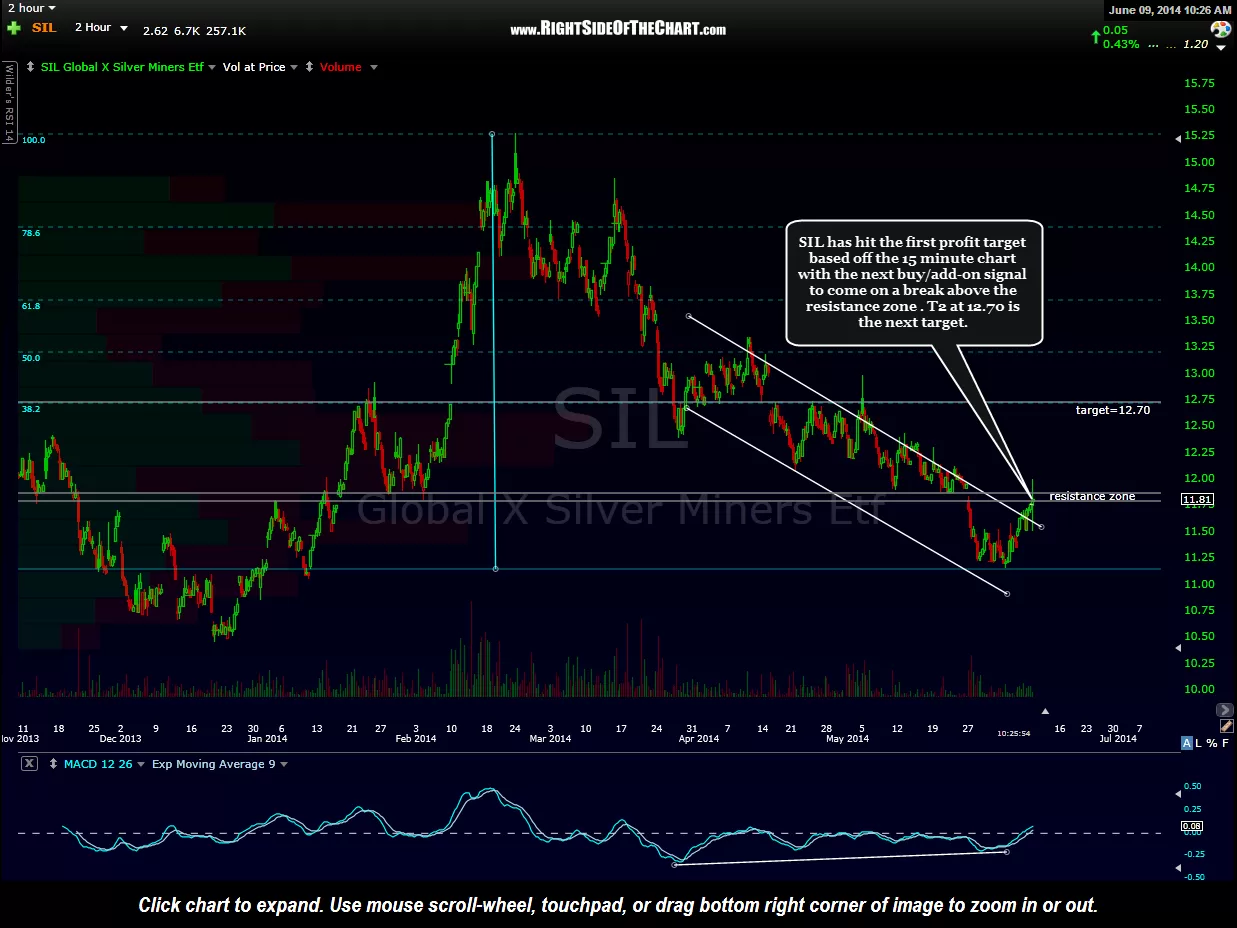
With both GLD & SLV (Gold & Silver ETFs) both trading higher today and the overall near-term price action more bullish than bearish, I will go ahead and add an additional price target on the SIL trade at 12.70 as per Friday’s comments (as shown on the 2 hour chart). Therefore, while more active traders might consider booking full or partial profits on SIL here at 11.80, typical swing traders might opt to raise stops to protect profits while holding out for the next target. As discussed in Friday’s comments, the next buy signal on SIL will come on a break above the top of the resistance zone shown on both these 15 minute & 2 hour charts, which comes in around the 11.90-11.95 area.