
While far from a well balanced & diversified index, the tech-heavy Nasdaq 100 has definitely been doing most of the heavy lifting for the entire stock market lately. This first chart below is the 15-minute time frame of /NQ (Nasdaq 100 futures) with some key near-term levels to watch. Any pre-FOMC breakdowns should be taken with a big grain of salt while any solid post-FOMC 2:30 press conference breaks of this uptrend line/rising wedge & then any & especially all of the market support levels below would would trigger sell signals/objective short entries. No breakdowns, no sell signals & again, best to wait until the “post-FOMC noise” is out of the way before reading too much into the likely rips & dips between the 2pm rate decision & subsequent press conference at 2:30 pm.
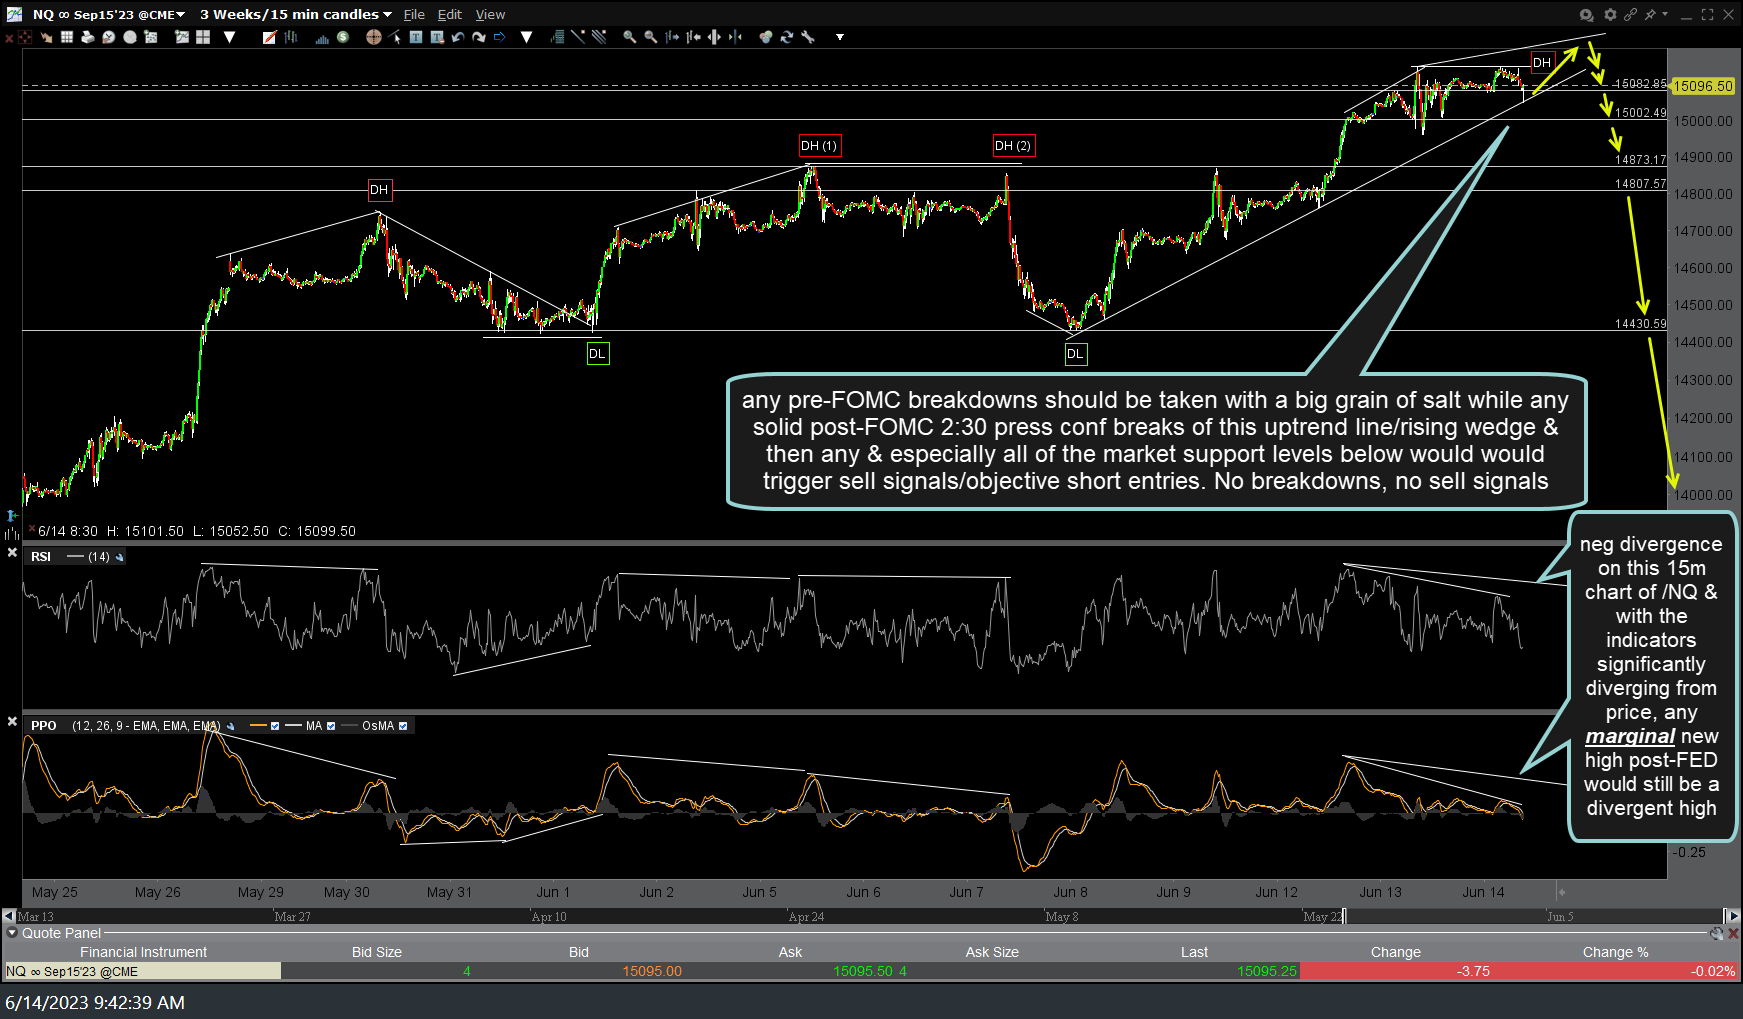
NQ 15m June 14th
The recently highlighted negative divergences on this 15-minute chart as well as the more significant 60-minute & daily charts are still intact for now, with the indicators significantly diverging from price. Any marginal new high post-FED would still be a divergent high while a more significant (mid to high double-digits) post FOMC rally has the potential to ‘negate’ or take out those divergences.
Zooming out from the 15-minute time frame to the much bigger picture via this 60-year monthly chart of the S&P 500 index (a much more accurate representation of “the stock market” vs. the Nasdaq 100, which only dates back to the late 80’s), I continue to monitor two of my longest term trend indicators which remain on sell signals since early 2022 although both are currently poised to flip to bullish unless the $SPX closes the month 5% or below current levels.
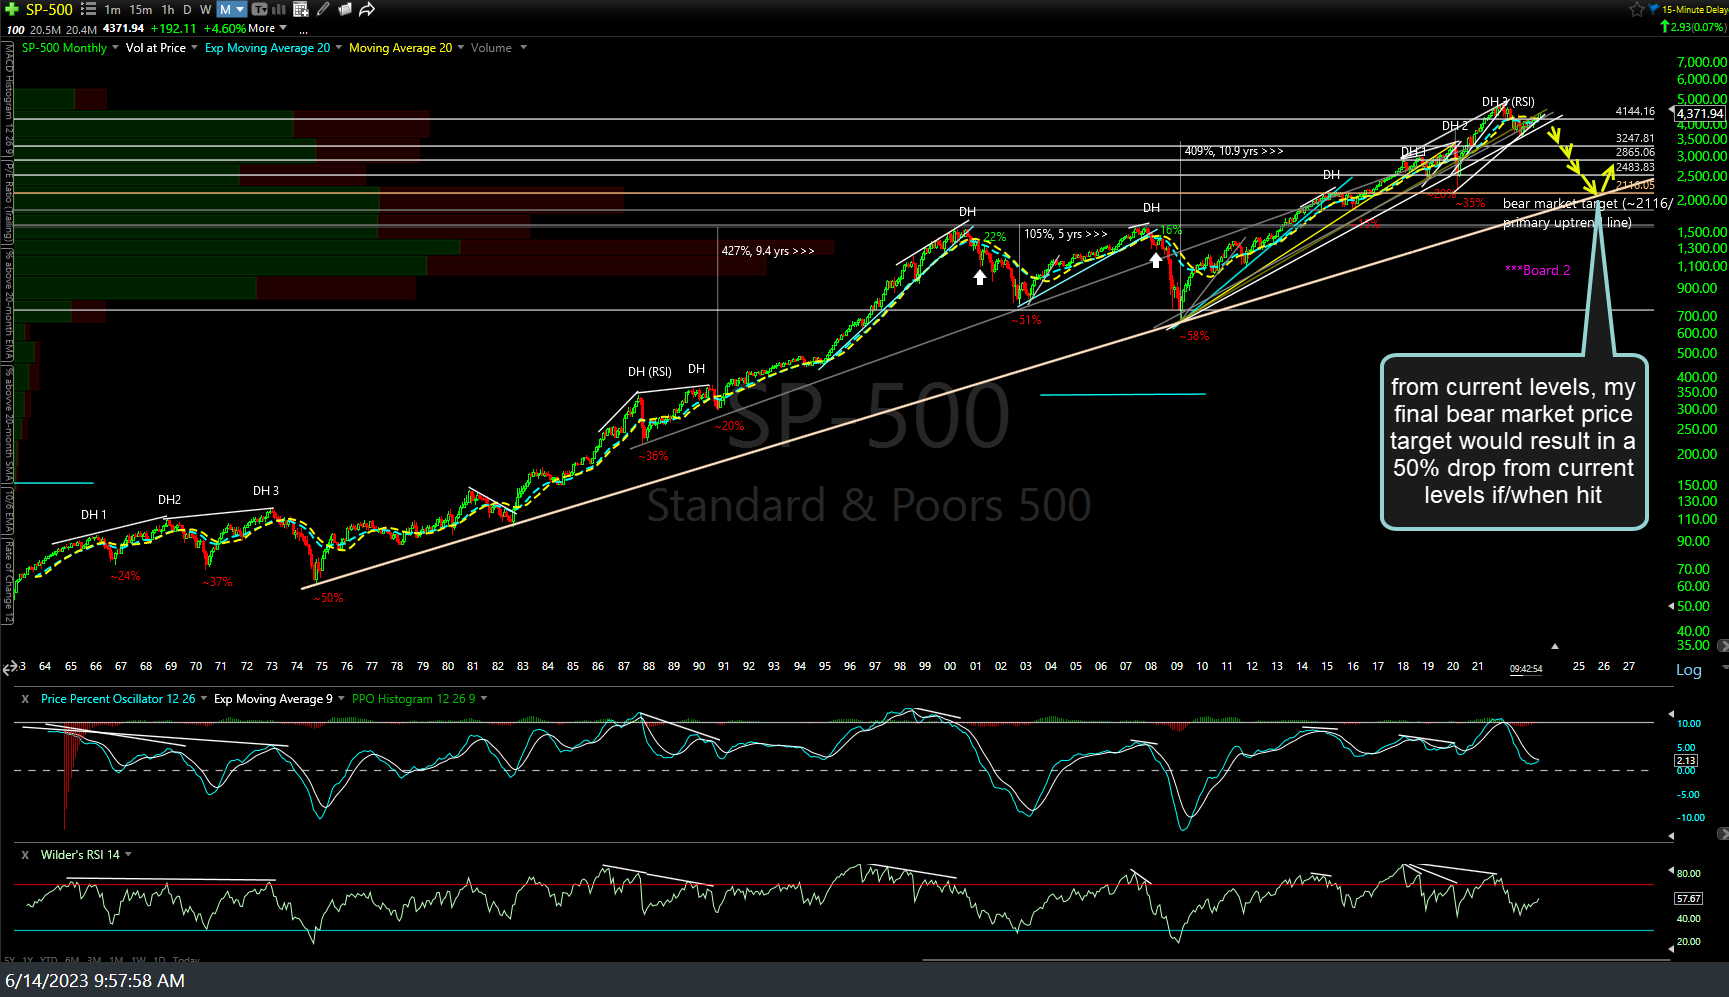
SPX monthly June 14th
The monthly PPO histogram trend indicator remains bearish (below zero line) with June having the potential to either see a bullish crossover or rejection off the zero line to keep that long-term indicator bearish as do the 20-month moving averages (blue dashed line is the 20-month EMA & yellow line is the 20-month SMA.. both of which have done an excellent job of delineating bull & bear markets when the $SPX is above or below them). As this is a monthly time frame, buy & sell signals ONLY come on a monthly closing basis (i.e.- how this month candle is finalized at 4pm on Friday June 30th). The next chart below is a close up of the same monthly chart for reference.
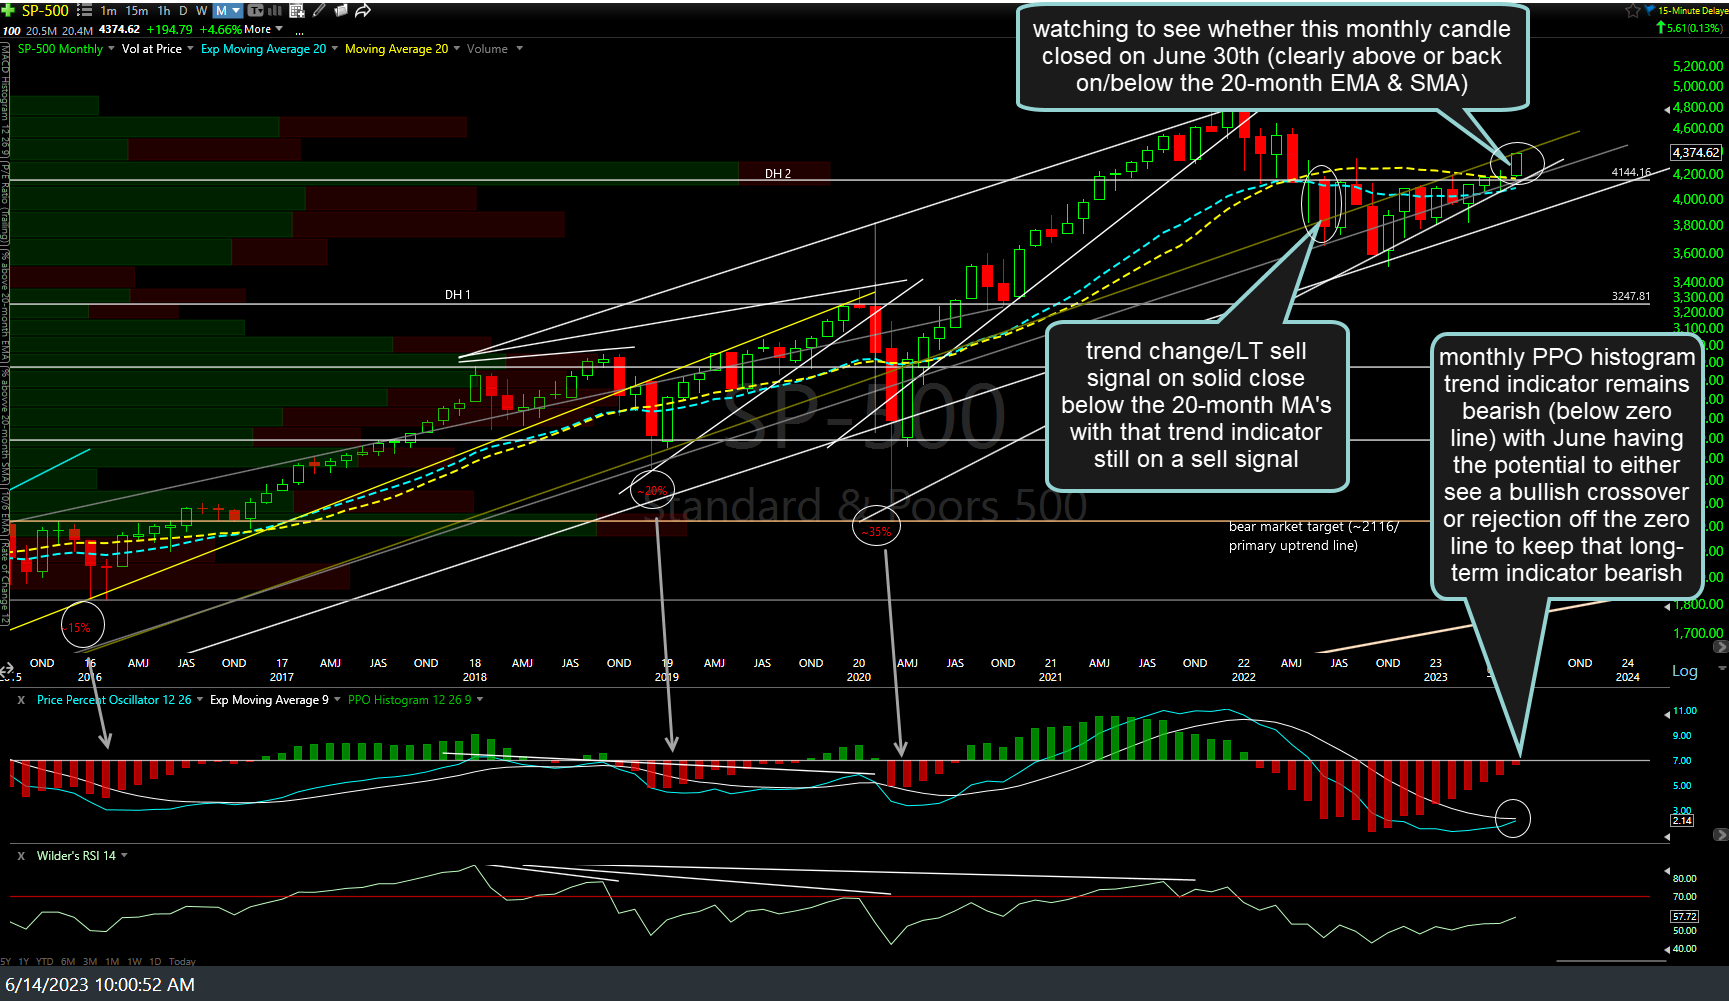
SPX monthly 2 June 14th
A lot can & will likely happen over the next two weeks but again, the short-term (15-minute, 60-minute, etc..) charts are much more useful for active traders while the weekly & monthly charts help to see the bigger picture/trend. Should we get a 5%+ drop over & at the end of the next two weeks, this would simply be another backtest of those key 20-month MA’s from below & most likely keep the PPO histogram on a sell signal as well. Likewise, a solid rally to close the month well above current levels would flip those particular indicators from bearish back to bullish for the first time in over a year.