
Below are several indicators used to quantify bullish & bearish sentiment in the stock market. I’ve found that these indicators only provide useful, predictive value when at extreme readings & even then, no one indicator is 100% effective all the time. Additionally, spikes to my extreme bullish & bearish levels are not exact timing indicators as sometimes spikes to the bullish or bearish extremes are almost immediately followed by a tradeable top or bottom in the market while other times bullish or bearish extreme readings persist for weeks or even months before the market turns.
This first indicator below is the AAII Bull-Bear Spread which measures the spread between the percentage of those bullish vs. those bearish, with the results of the AAII survey published weekly. More on the AAII Bull/Bear survey can be found by clicking here & the most recent survey results can also be viewed here. As the chart below shows, the bull/bear spread recently hit my “Red Zone” (extreme bullishness) for the first time since 2018. The S&P 500 fell 12% in 2-weeks shortly after the early-2018 spike into the Red Zone with the stock market going on to make a marginal (only 2% above the early 2018 high) new high before plunging 21% in Q4 ’18.
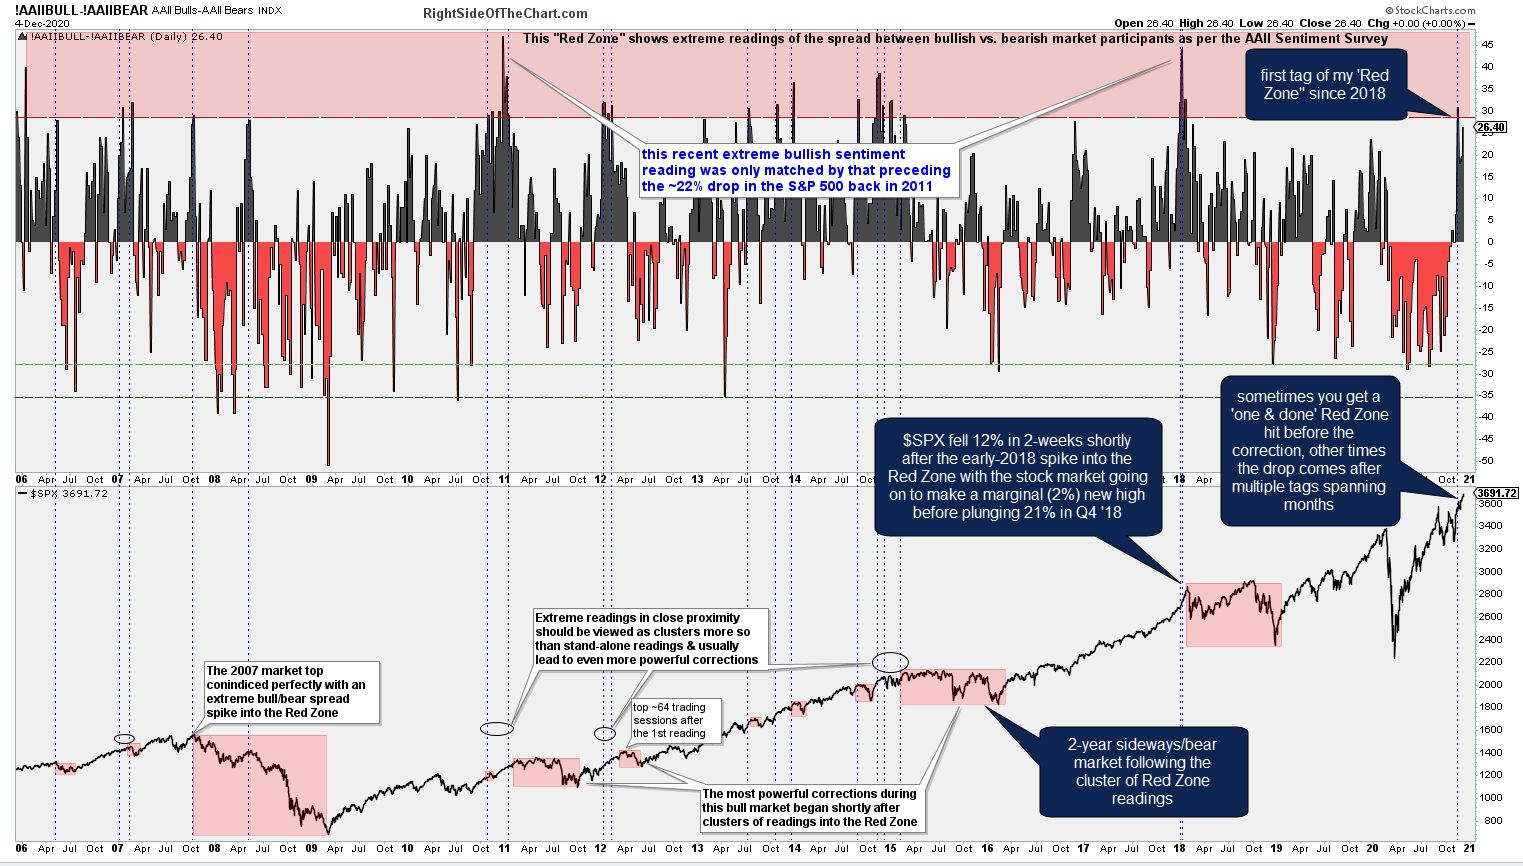
AAII Bull-Bear Spread 12-4-20
While the AAII Sentiment Survey has certainly been useful in helping to predict major tops & bottoms in the past, one of the limitations with sentiment surveys is that they show when market participants are bullish or bearish in rhetoric but not necessarily in thier positioning. For example, I might check the “bullish” box on the survey one week, stating that I am expecting the market to rise in the coming months, yet I may or may not end up buying stocks as I could very well change my outlook.
The two indicators below show how market participants are actually positioning, regardless of what they say. Given, there are other factors that move the put-to-call ratios, such as hedging, but overall, these two indicators have done an excellent job of helping to predict major tops & bottoms in the stock market in the past.
The first chart below is the $CPC (CBOE Options Total Put/Call Ratio). I have a green “buy” line on my chart around the 1.50 level which indicates excessive fear. I also have two lines to identify levels of excessive bullishness; the orange line around 0.64 and the red line around 0.56. Tags of the orange line often, but not always, precede decent (tradable) corrections while single taps or clusters of drops down to the red line have been followed by substantial corrections & bear markets over the past decade+. This recent cluster of drops to the orange line shows an unusually persistent period of excessive bullishness with only relatively minor corrections following the recent tags so far.
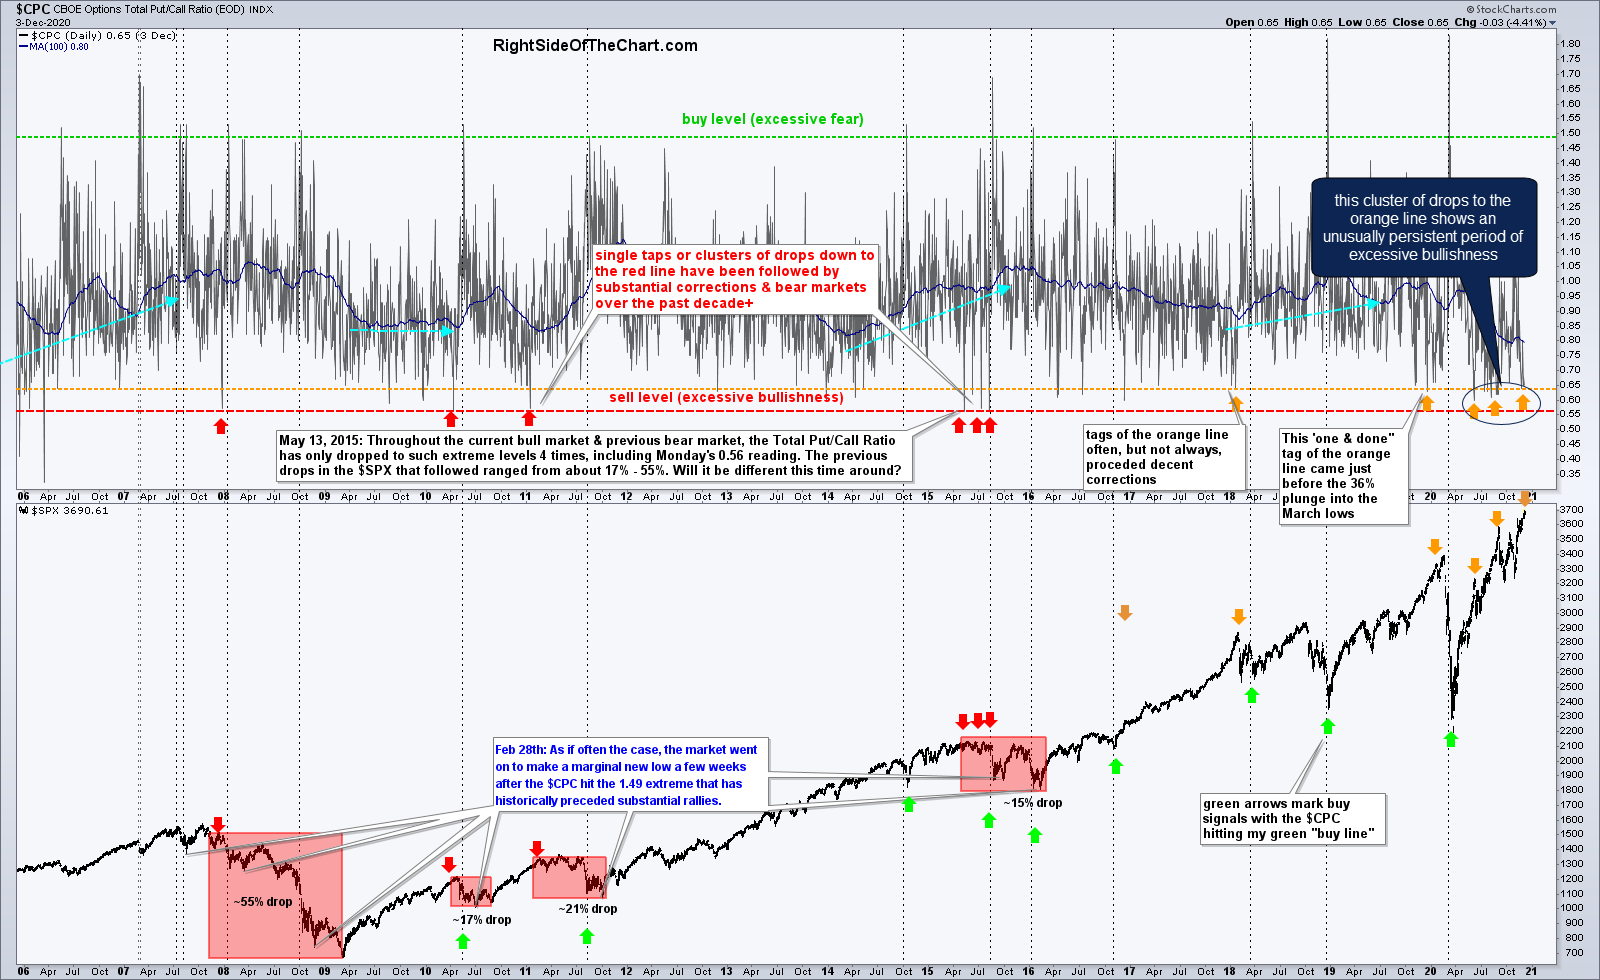
$CPC daily Dec 4th
The next chart below has an even better track record of identifying major tops & bottoms than the $CPC. The $CPCE is the CBOE Options Equity Put/Call Ratio, a measure of bullish vs. bearish bets on individual stocks (excluding indexes). Tags of my green line around 1.13 have provided some of the best long entries in recent years while drops down to my red “extreme bullishness/complacency” line around 0.38 have always been followed by substantial corrections in recent years. Once again, I consider multiple tags of the green & red lines as a single, extended period of excessive bullishness or bearishness. The recent cluster of drops to my red line shows that have been in a period of extreme bullishness since June with only relatively small corrections following the red line tags in recent months.
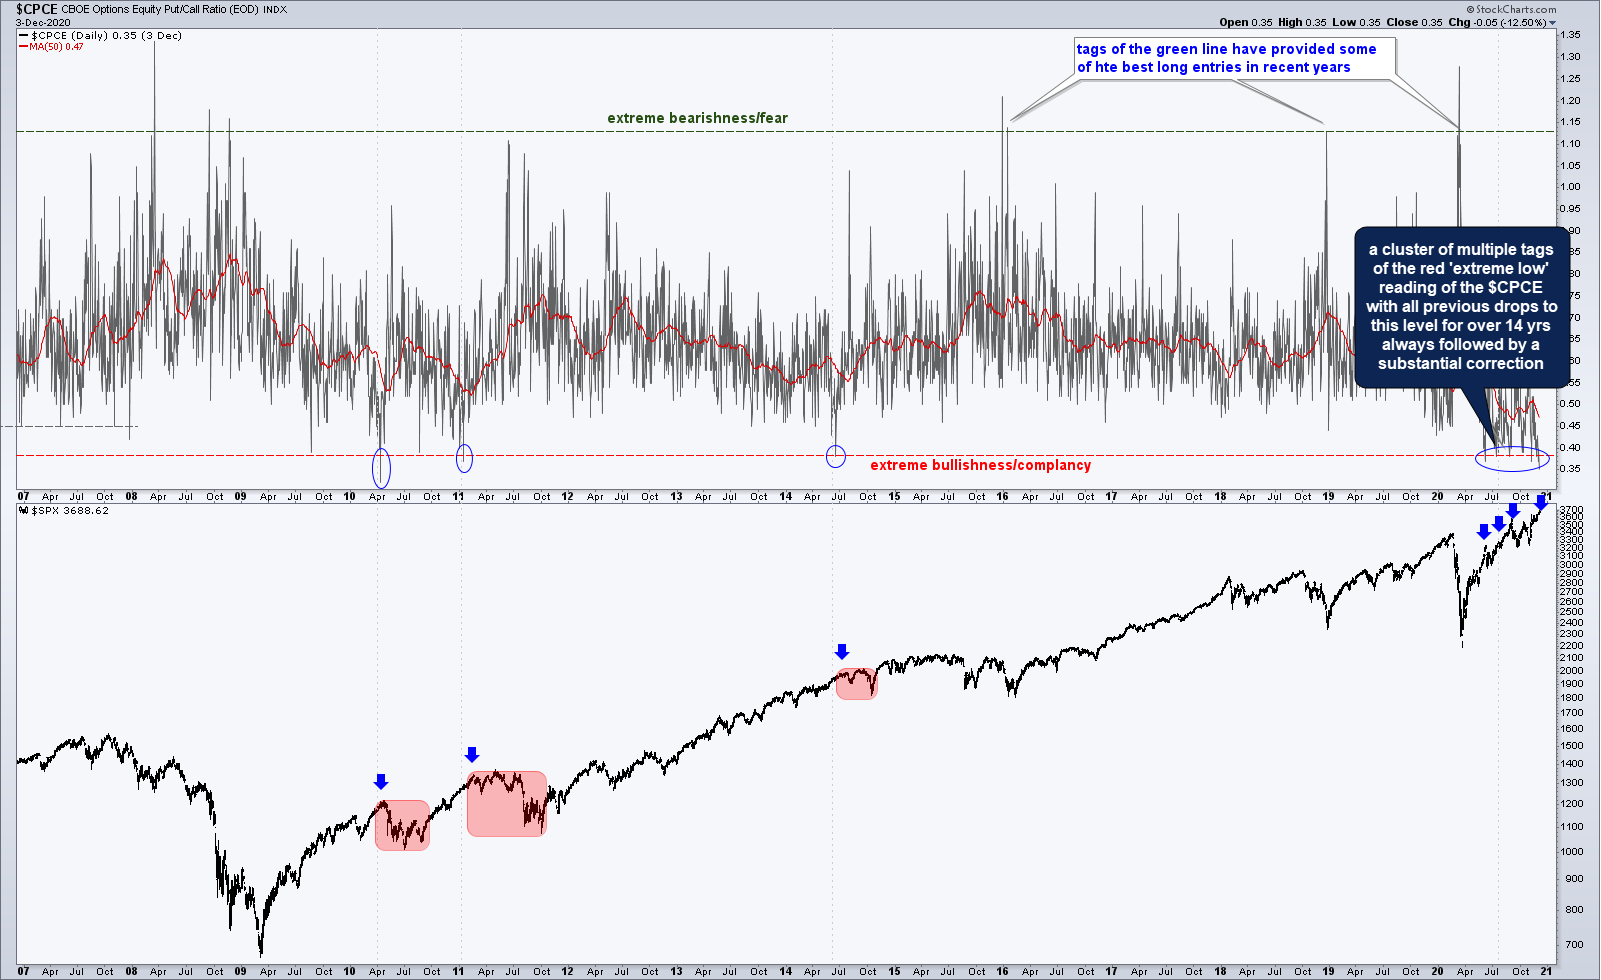
$CPCE daily Dec 4th
Bottom line: These sentiment indicators, even at extreme levels, are NOT exact timing indicators, rather an insight to excessive sentiment that is often, but not always, followed by substantial trend reversals. As discussed in this video published earlier today, both the near-term & intermediate-term trends in the stock market remain bullish without any sell signals at this time.
One of the useful applications of identifying periods of extreme sentiment readings that come following an extended bull or bear run is that they can often help to predict the more significant inflection points in the market (major bottoms & tops) vs. run of the mill rallies & corrections within a trend.