
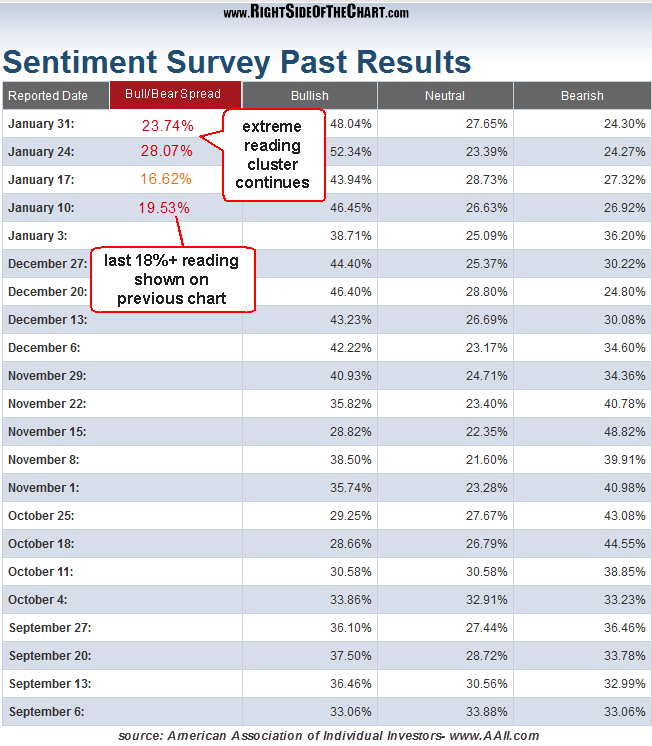
 I wanted to make an update to the recent post made on January 10th that highlighted the track record of major buy and sell signals based on extreme bull-bear spread. As was discussed in that post, bullish and bearish extremes (+/- 18% or higher) often come in clusters, as the sentiment extremes can persist for weeks at at time before manifesting in the form of a trend reversal. For those who have not read that post, it can be viewed by clicking here. That recent chart reflected the extreme buy & sell signals through the reporting date of January 10th and as you can see from the subsequent weekly AAII Sentiment Survey results, the extreme bullish readings not only continue to persist, but have actually moved further into extreme bullish levels over the last couple of weeks. There are a couple of things to keep in mind when incorporating these buy & sell signals into your trading or investing:
1) They are useful in signaling both tradable corrections as well as major trend reversals, often lasting weeks or months and although not 100% effective, as the chart in the previous post indicates, they have triggered buy and sell signals within a few percentage points of every major top and bottom as far back as I went with the signals (March 2009, the start of the bull market).
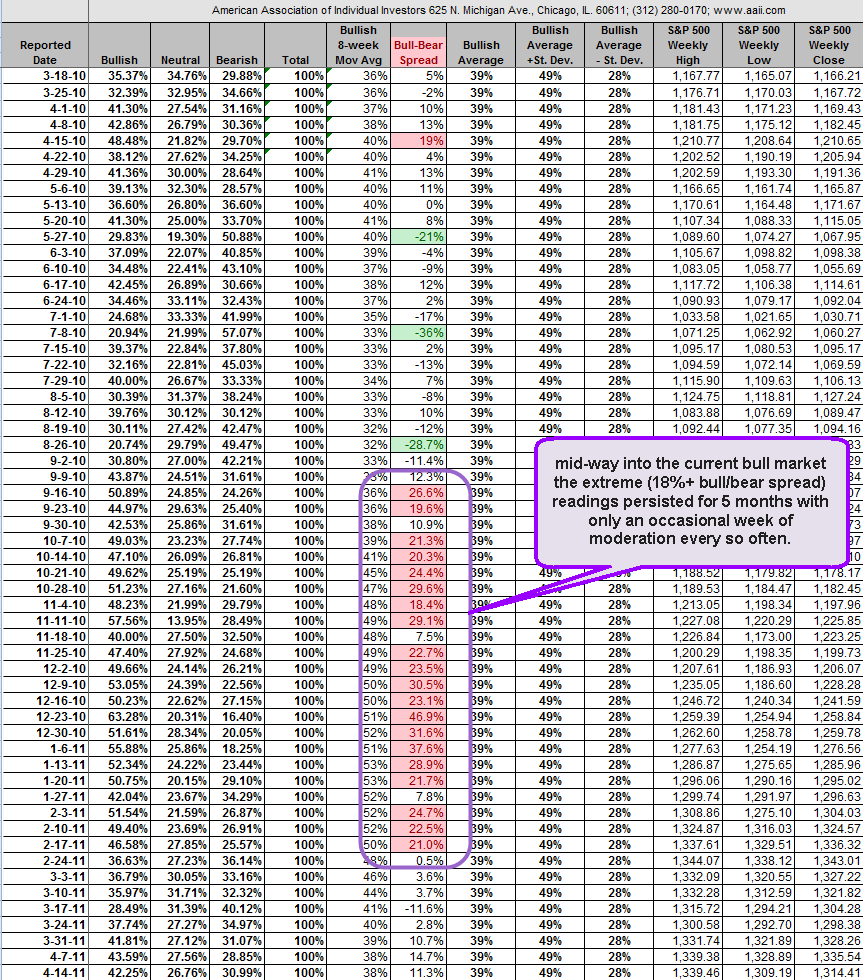 2) As these signals are used to help identify potential corrections and/or larger trend reversals, they are not exact timing indicators and should be used in conjunction with other metrics in order to increase their effectiveness. Most importantly, as these extreme readings can, and often do, persist for several weeks at a time (clusters) it will only be shortly after the readings have backed off these extreme readings before the buy or sell signal is confirmed. In other words, the arrow that was placed on the last chart (Jan 10th) is part of a cluster of readings that continues to persist as of the most recent weekly sentiment survey results (Jan 31st) and as such, that arrow (sell signal) will be continued to be shifted forward until the bull/bear spread drops below 18% for at least two consecutive weeks. As an example, take a look at these extreme bull readings that persisted from 9/16/10 all the way to 2/17/11. That’s five months of extreme (18% or higher) bull/bear spreads and just like the January 17th reading of 16.62% (less than 1 1/2% below the 18%+ extreme), it is normal to get a week or two or readings below the 18% mark during a period (cluster) of extreme sentiment.
Bottom line is this: Although this indicator is just about as good as any out there on signaling major market turns, due to the fact that these extreme readings can & often continue to persist for weeks, possibly even months, it is not going to be useful in “nailing” the exact top or bottom. However, it could help you get positioned properly early on in a new trend before it is clear from the charts (and long before the general consensus) that new trend is now underway. Although several key indices, such as the S&P 500 & DJIA, have recently made new multi-year highs, these same indices are still just below even more significant resistance levels, their all-time highs reached at the peak of the last bull market in 2007.
One final thought that I have regarding the extreme bull/bear ratio readings. An argument that anyone who is bullish over the next 3-6 months might make would be: “Sure, just look at how high the market climbed during that 5 month run of bullish extremes that you highlighted above. Maybe we go that long or further this time around”. Possible? Of course, as anything in the stock market is possible. Likely? Not in my opinion. Why? Well because that run was smack in the middle of the current bull market and although there’s no way of saying with absolute certainty that we’re not in the middle of a bull market that started in January 2009 right now, what we can say with certainty (and although the numbers do vary based on the source you reference and the time period observed); the historical average for bull markets is about 3.8 years. March 6th, just over a month from now, will mark the 4th anniversary of the current bull market. Pretty much the same can be said about the business cycle, which, as per Investopedia: Since the World War II, most business cycles have lasted three to five years from peak to peak. The average duration of an expansion is 44.8 months and the average duration of a recession is 11 months. Add to that the fact that the failure rate to the recent new highs on many indices and sectors is quite high due to extreme overbought measures (extreme readings on 52 week high, stock above 200 MA, weekly and daily oscillators, VIX, etc, etc, etc….) and I would say the odds favor these recent bullish extreme readings manifesting into at least a significant (10%+) correction in the very near future.
Short-term, more active/nimble traders might continue to play the trend or even find success in trading the best setups, long and short while longer-term investors might considering aggressively trailing up stops on their longs while being very selective when taking any new long positions going forward. There are also many longer-term bearish setups & active trades, such as AMZN, OSTK, MA, V, NTRI, etc.. that could make very attractive hedges to a net-long portfolio. I will continue to add both long & short trade ideas to the site regardless of the market trend or inherent risk to trading or investing but I will say that I believe the R/R to being positioned aggressively long or short at this point is as about as poor as it’s been in a while.