
I’m on the train to Florence trying to work off an extremely spotty & sluggish WiFi connection, trying my best to catch up on the charts & figured I’d start with a couple of market breadth & sentiment indicators that have reached/triggered some rarely seen extremes.
In one of the recent videos I posted about a week or so before leaving for vacation, I had covered some breadth indicators including my customized “Nasdaq” variation of The Hindenburg Omen which had just recently triggered the first of a rarely seen signal (all criteria met) in quite some time. Noticing the stark underperformance between the equal-weighted S&P 500 ETF (RSP) and SPY (as well as QQQ) since I left town, I decided to check it again & it appears that all criteria were met again yesterday. As with any breadth indicator (as well as sentiment indicators), this is not an exact timing indicator, rather a set of unusual market conditions that have historically preceded some (but not all) significant drops in the stock market.
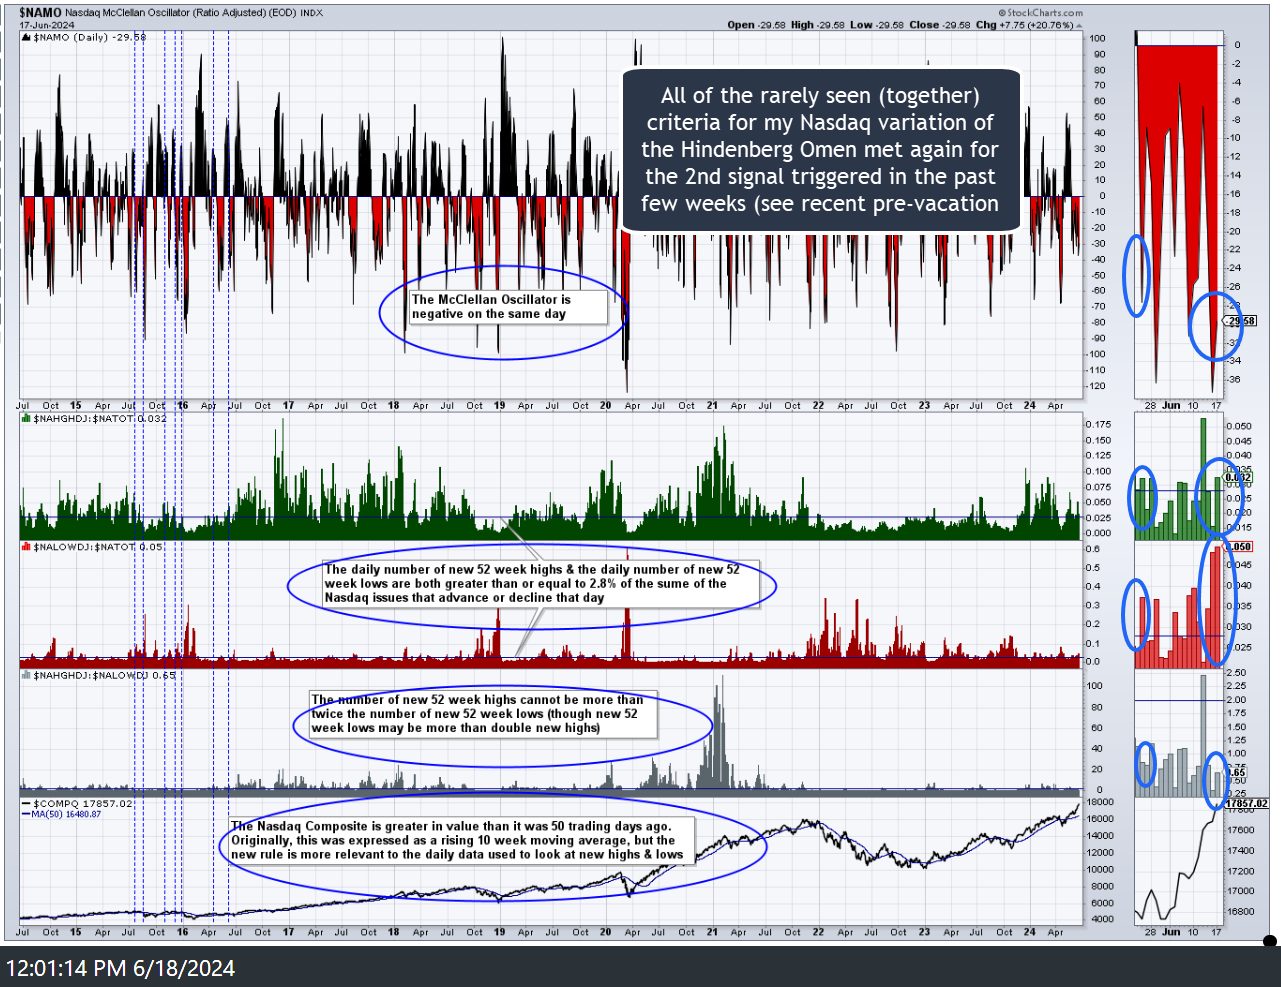
Nasdaq Hindenburg Omen June 18th
Reviewing my various sentiment indicators, I also noticed that the $CPC (total put to call ratio) has also plunged to a level last seen back in Nov 2021, just before the Nasdaq 100 peaked & fell 38% into the Oct ’22 lows (two variations of that chart below):

$CPC daily June18th
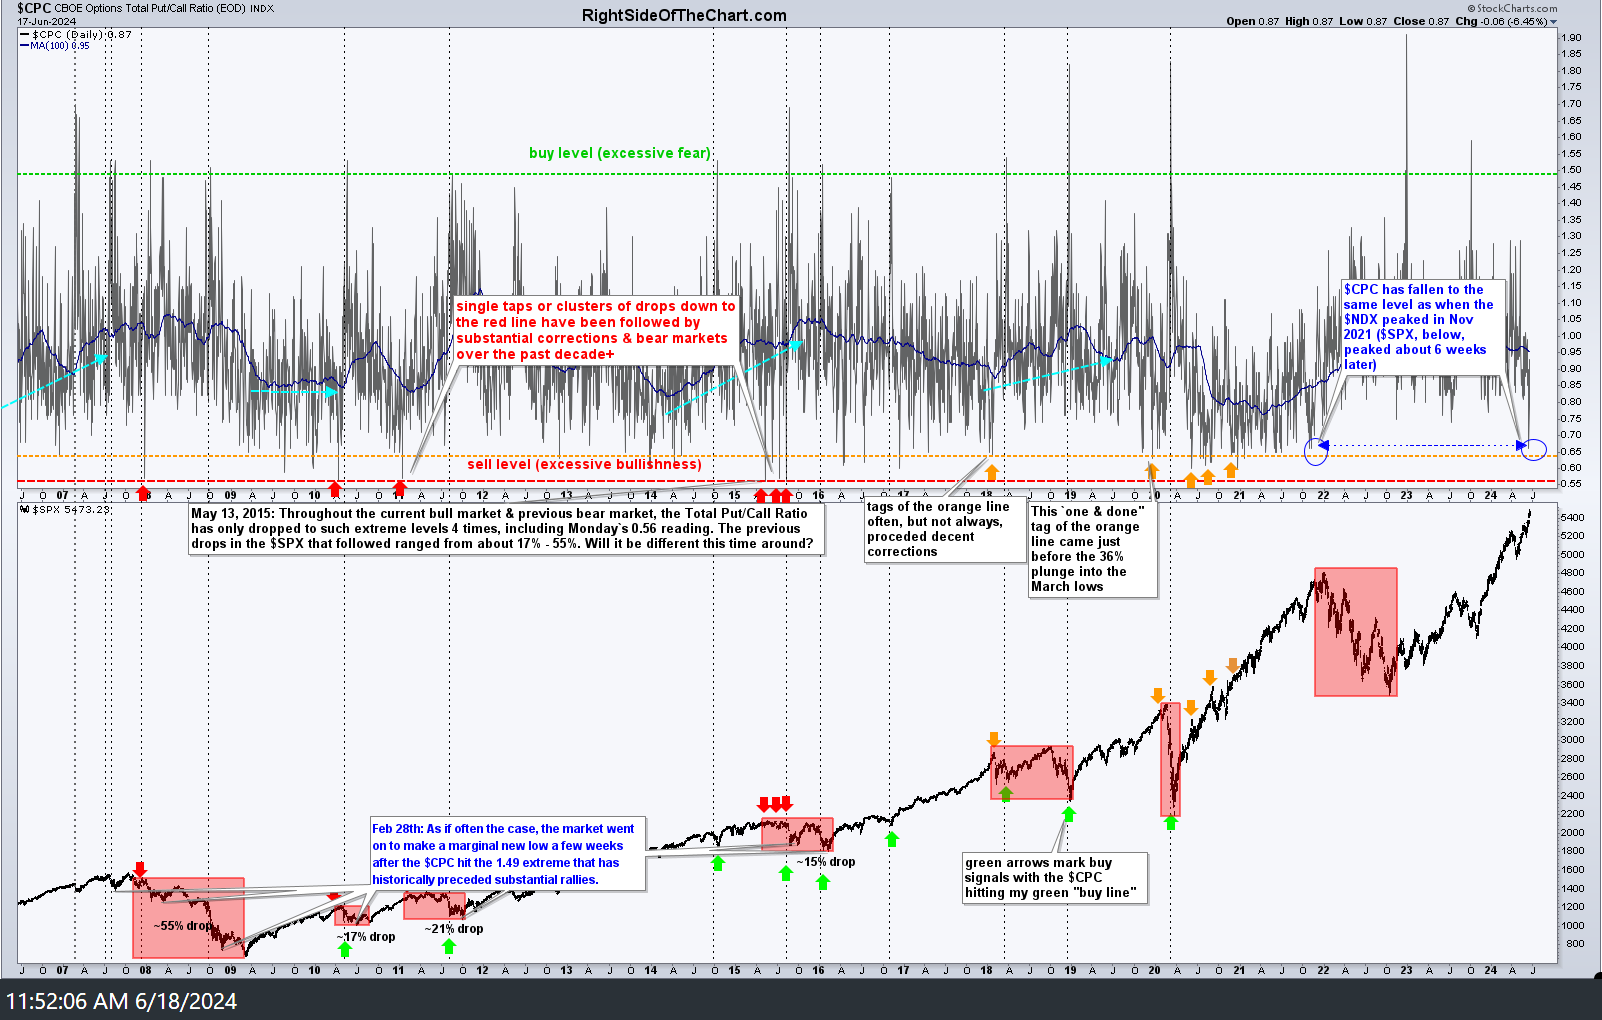
$CPC daily 2 June 18th
If you study the charts above, you will see that the $CPC has a fairly accurate track record of signaling significant tops & bottoms in the stock market when at those extreme readings. However, this sentiment indicator, just as with the various breadth indicators (including the Hindenburg Omen) are not exact timing indicators, often providing a “cluster” of multiple drops to my extreme buy or sell levels in advance of the turn and, at times, dropping or spiking up to the sell or buy levels without any significant trend change following. But taken as a whole, the track record seems quite, if not, very accurate. Additionally, there are several instances where the $CPC spiked or fell to the buy or sell levels with a major turn in the market following almost immediately.
Again, these breadth & sentiment indicators show unusual market conditions that are often associated with directional changes in the stock market. As always, it is best to wait for additional supporting evidence, such as decent buy or sell signals, in order to determine if, how, & when to position for a trend change.
That last short-term sell signal on the 15-minute trend line break I posted just before I left for vacation was “undone” before the ink even dried with an immediate reversal & recovery back above the trendline (to negated or invalidate the signal; i.e.- a whipsaw) so I’ll do my best to catch up on the charts of the major indices & post some key trendlines, support levels, & potential developments to watch for asap.