
Members @ww0987 & @Ruben had requested an update on the semiconductor sector. XSD (SPDR S&P Semiconductor ETF) has been clinging to the bottom of this large rising wedge for weeks now & but has yet to confirm a sell signal with an impulsive breakdown & solid daily close below the wedge although best to wait to see all three semiconductor ETFs break down before aggressively shorting the semis.
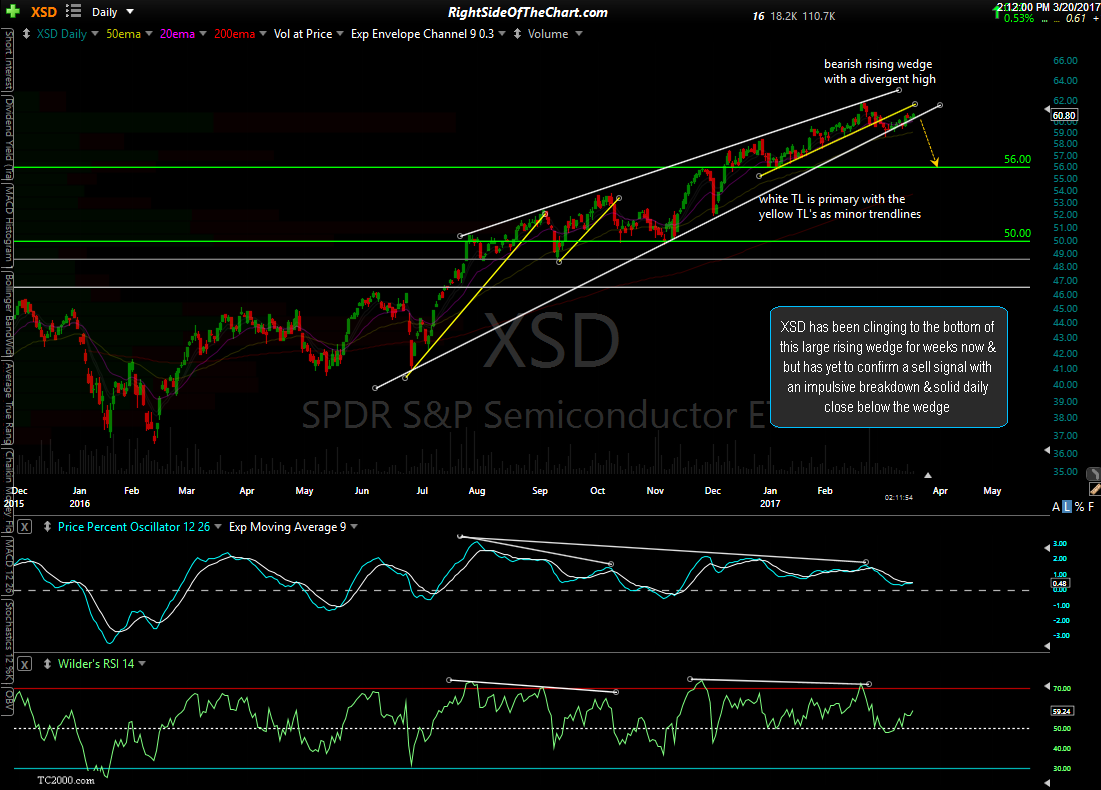
XSD daily March 20th
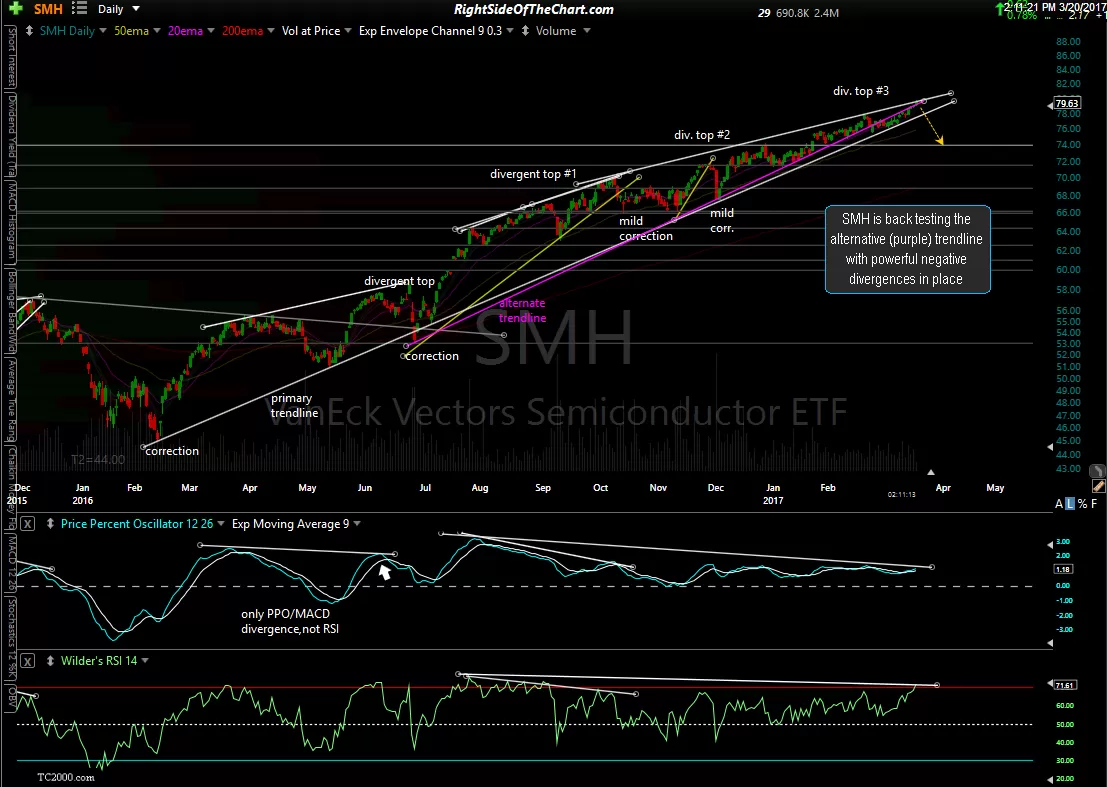
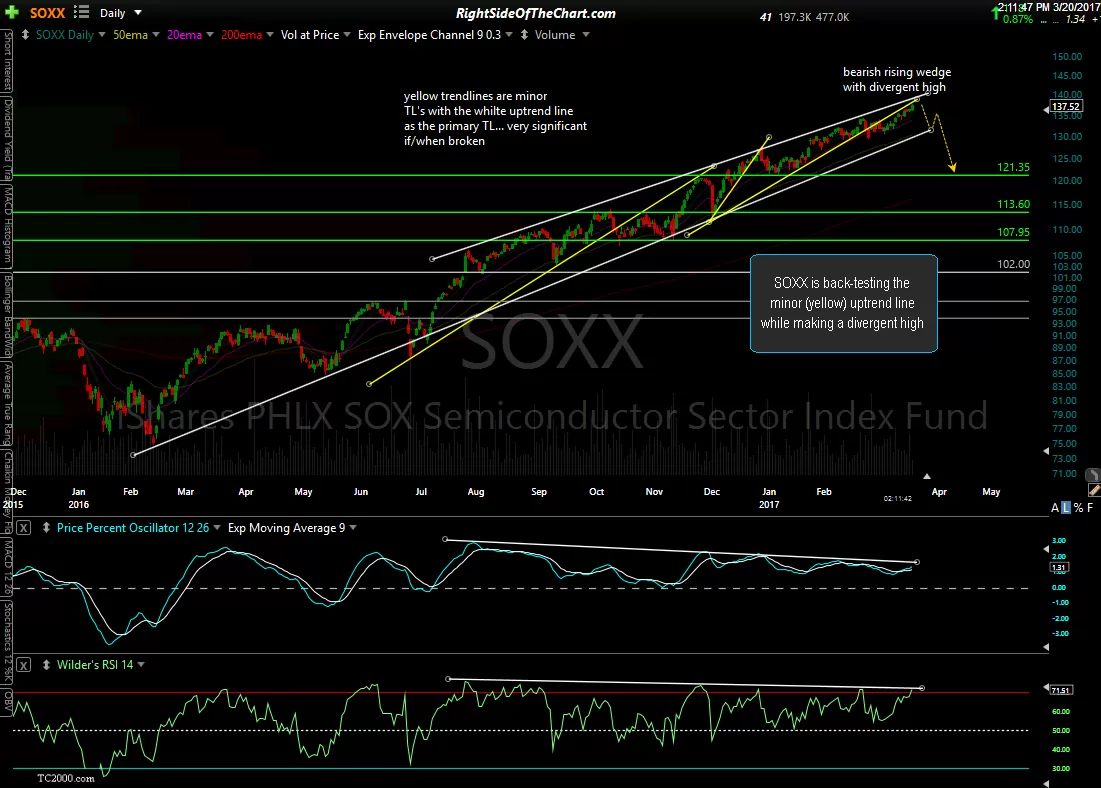
SMH (VanEck Vectors Semiconductor ETF) is back testing the alternative (purple) trendline with powerful negative divergences in place while SOXX (iShares PHLX SOX Semiconductor Sector Index Fund) is back-testing the minor (yellow) uptrend line while making a divergent high.
-
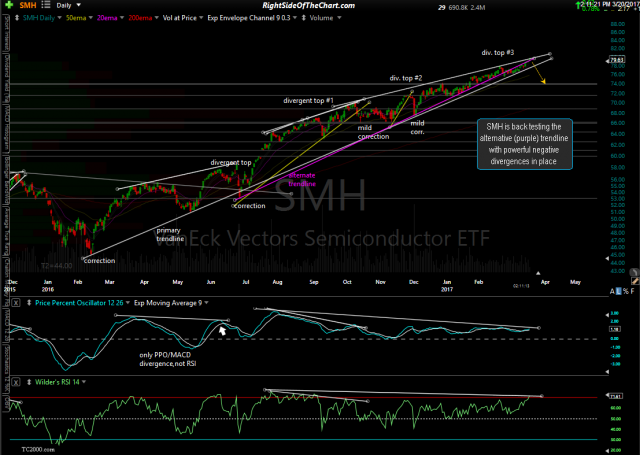
- SMH daily March 20th
-
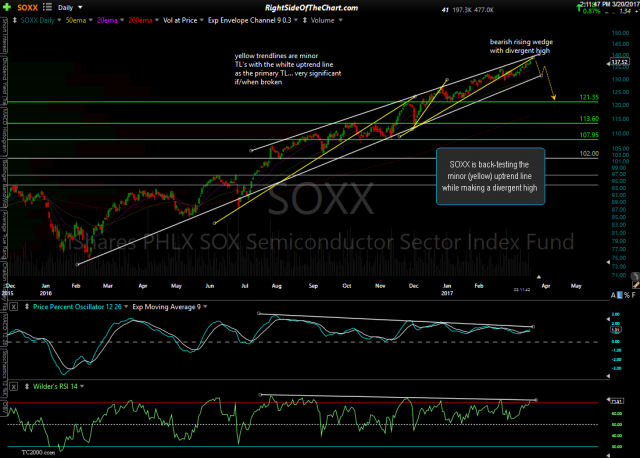
- SOXX daily March 20th
Here are some additional comments regarding the semis & rising wedges in general via my reply to the following question from @ww0987:
Randy, any update on thoughts regarding semiconductor stocks, particularly the SMH and SOXL etfs? They seem to be breaking upwards out of their rising wedges. One can always hope for a bull trap breakout, followed by a collapse back through the support line of the wedge. . .
Yes, I do have some thoughts on that. I’ll post some update charts on the semi ETFs in a new thread above asap. For the most part, the upper-most lines on a rising wedge, at least the way I use them, are more so to show the divergences between the first reaction high & any other reaction highs -OR- where prices are currently trading.
As such, the upper line on a rising wedge, just as with the lower line on a bullish falling wedge, isn’t so much a trendline as it is a visual to highlight the divergence against the indicators below.
As such, the upper-most line on a wedge is often subject to revision if/as prices move higher, as long as the divergences on the indicators are still intact.
The lower line on the wedge is the much more significant level of the two as that is typically a well-defined uptrend line defined by multiple price reactions & the more reactions off that TL, the more valid & significant it is.
Until & unless the indicators (MACD, PPO, RSI) start to make higher highs, thereby negating the divergences that are in place on a rising wedge, the wedge is still valid but as with all wedges, prices can continue to push higher & the sell signal does not come until/unless prices break down below the bottom of the wedge. Charts to follow soon. (end reply)