
/SI silver sell has triggered a signal on this breakdown below the minor uptrend line on the 60-minute chart below. Unadjusted targets (actual support levels) marked at the arrow breaks.
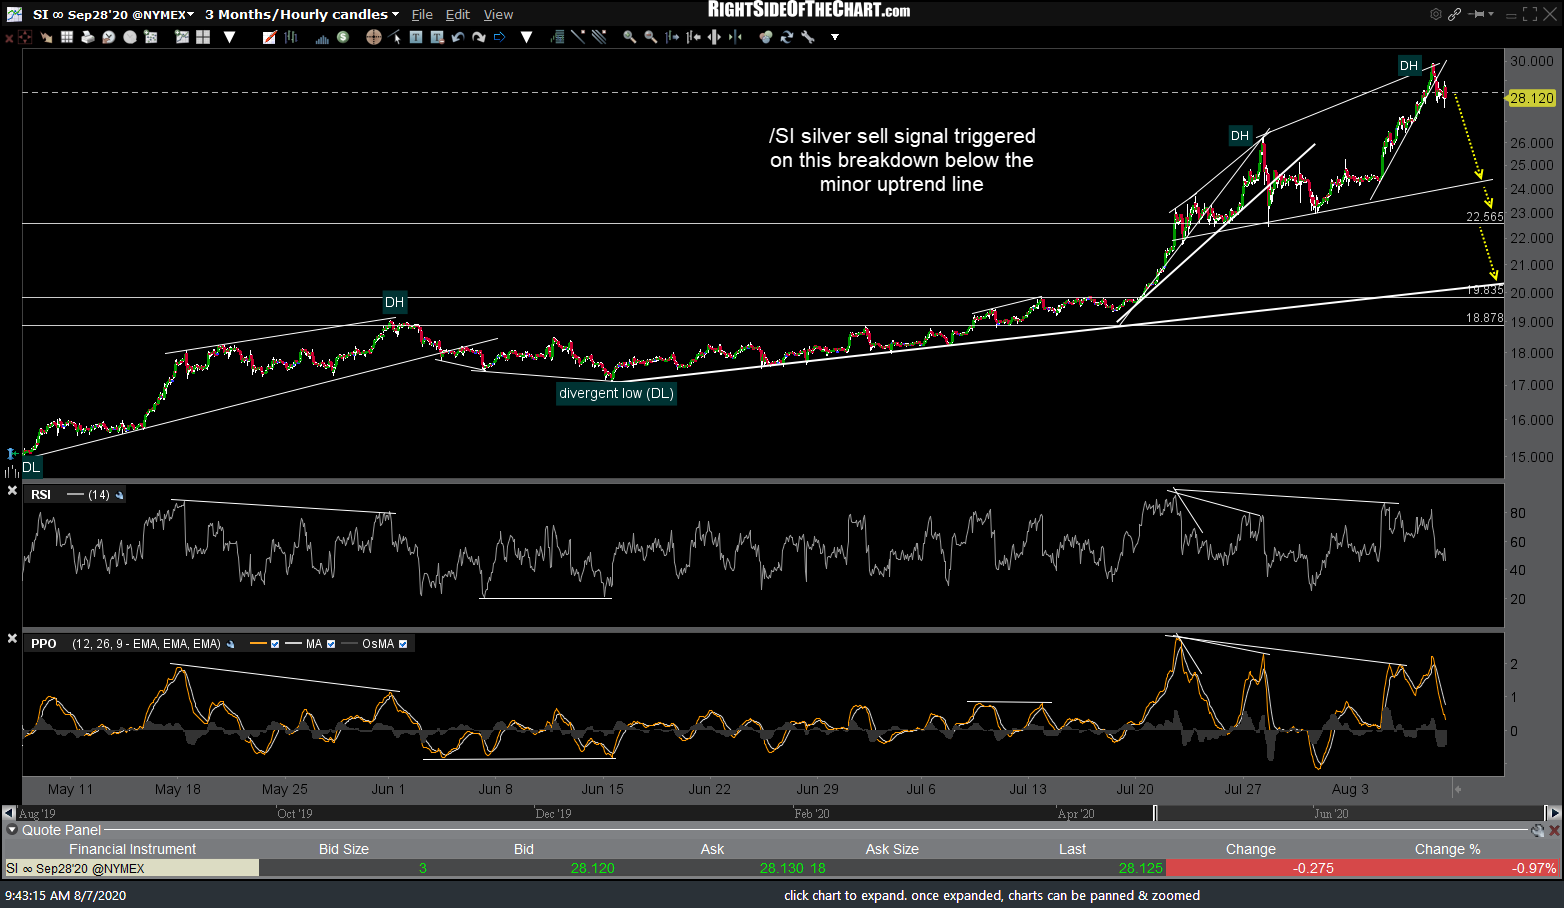
SI 60m Aug 7th
The 60-minute chart of ZSL (-2x short silver ETF) shows some potential swing targets which are likely to come into play if the breakdown in silver sticks.

ZSL 60m Aug 7th
Likewise, /GC (gold) is starting to crack below the first uptrend line with a sell signal to come on a solid 60-minute close below it. Keep in mind that the odds of silver correction will increase substantially if this breakdown in gold sticks with gold falling to any or all of these potential targets. Also note, these are only early, potential sell signals based on the intraday charts. The case for swing shorts on the metals and/or miner will firm up substantially if/when we get some solid sell signals on the daily & weekly time frames.
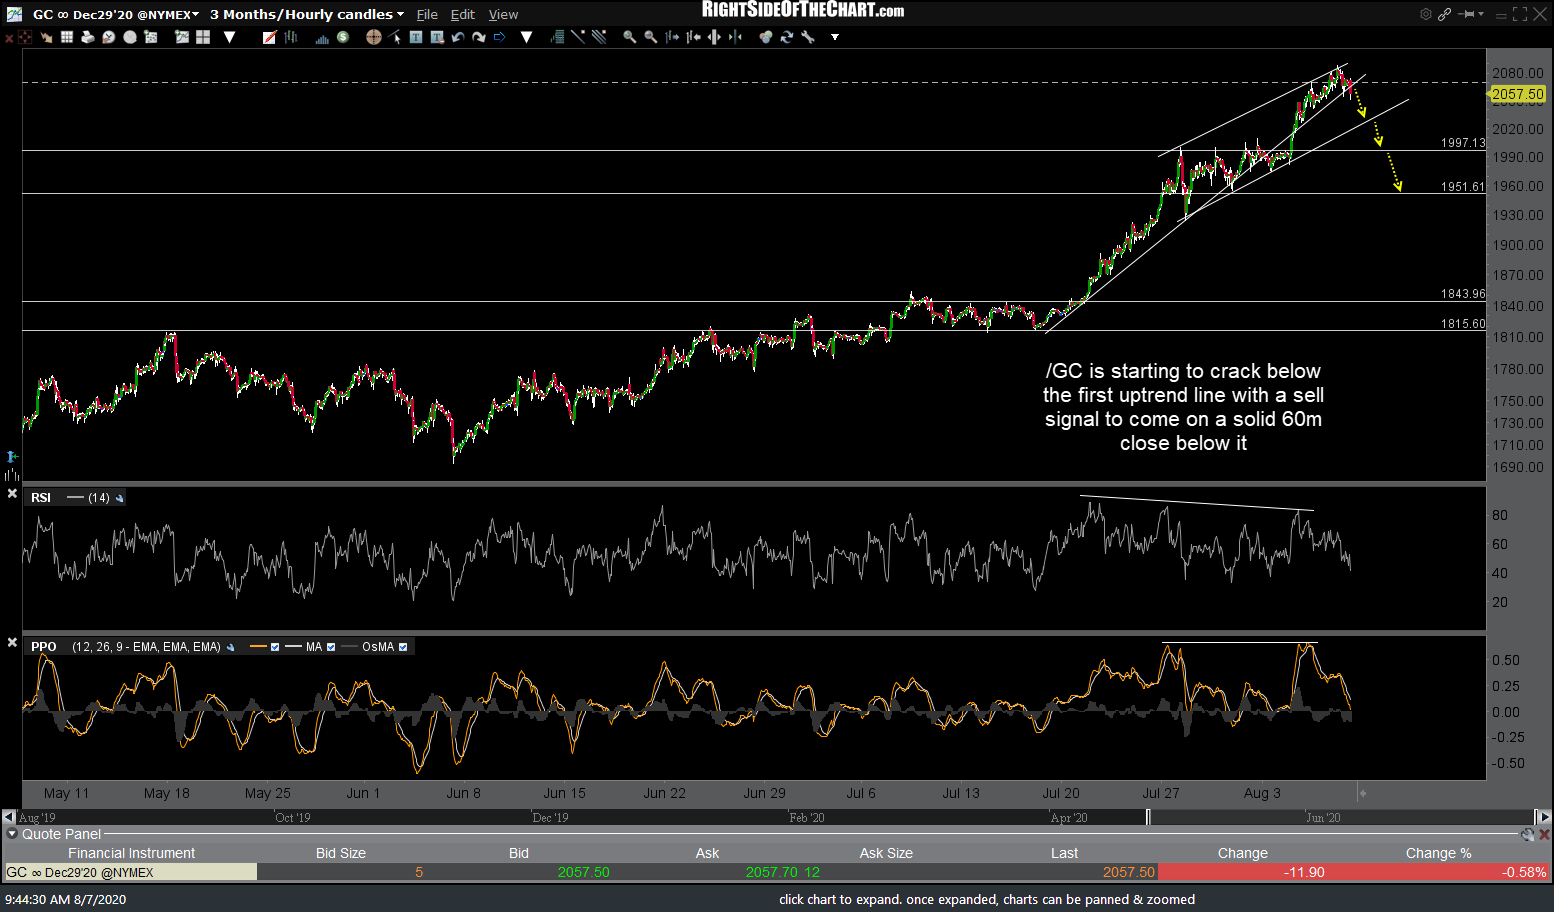
GC 60m Aug 7th
I will be away from my desk for most of today but will do my best to post a late-session update before the close today, should we get any significant developments in the metals and/or miners. Also, it still appears to me that select silver mining stocks are setting up to outperform to the downside when the next decent correction in gold & silver comes. Those setups can be referenced by clicking on any of the symbol tags for gold or silver (e.g.- SLV, /SI, $SILVER, GLD, /GC, $GOLD) located below this post. Once the archived posts load, click on any of the recent posts containing symbol tags for SIL and various silver miners such as ASM, PAAS, AG, etc…