
Both /NQ (Nasdaq 100) and /RTY (Russell 2000) broke out above the aforementioned resistance levels, triggering near-term buy signals with any backtest of those levels from above to provide another objective add-on or new long entry with stops somewhat below. Updated 15 & 60-minute charts with a video covering the indexes, market-leading stocks, Treasury bonds, & EUR/USD on the way.
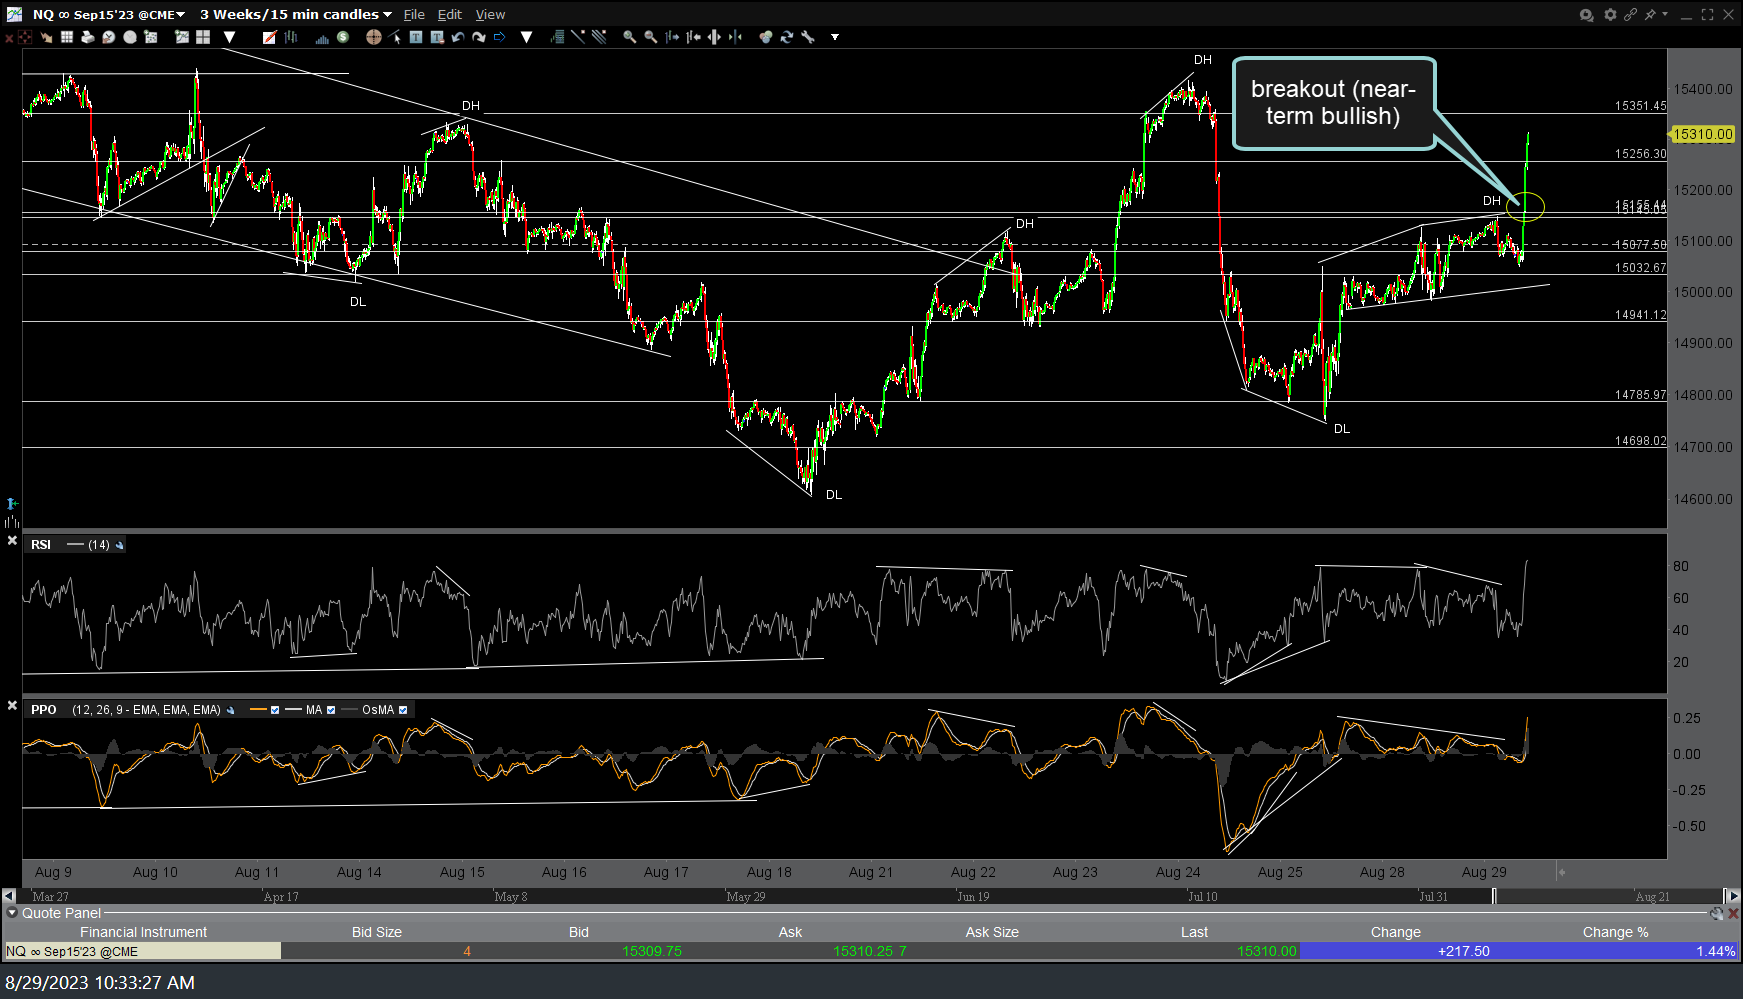
NQ 15m 2 Aug 29th
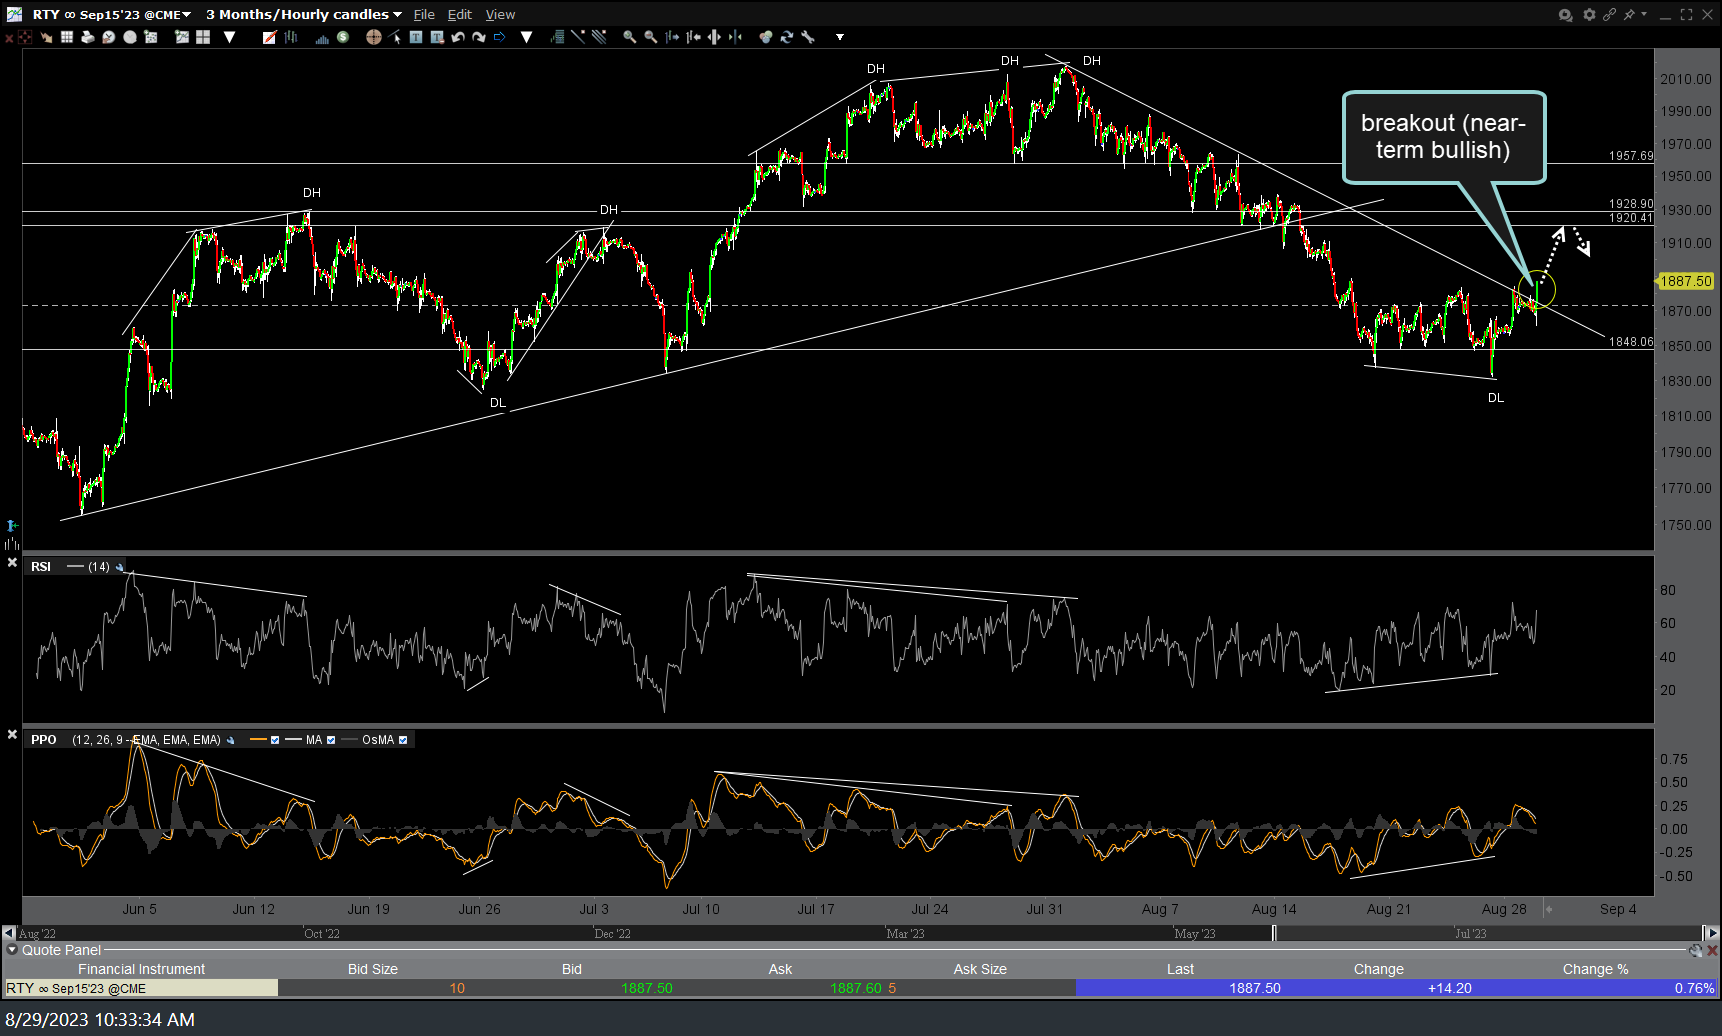
RTY 60m 2 Aug 29th
Again, these breakouts are near-term bullish until & unless they fail with the /RTY moving solidly back below the uptrend line & /NQ moving solidly back below the 15150ish former resistance, now support level.