
Over the years, I’ve discussed how, on very rare occasions, I like to use a similar set of notifications to members of RSOTC as the NWS (National Weather Service) uses to inform the public of the potential for impending or imminent hazardous weather conditions, such as a hurricane, tornado, or flooding. Just as with the NWS system, the likelihood of a particular area being affected by such hazardous weather isn’t a binary (all or none) system, but rather an incremental, 3-tiered scale, as shown below.
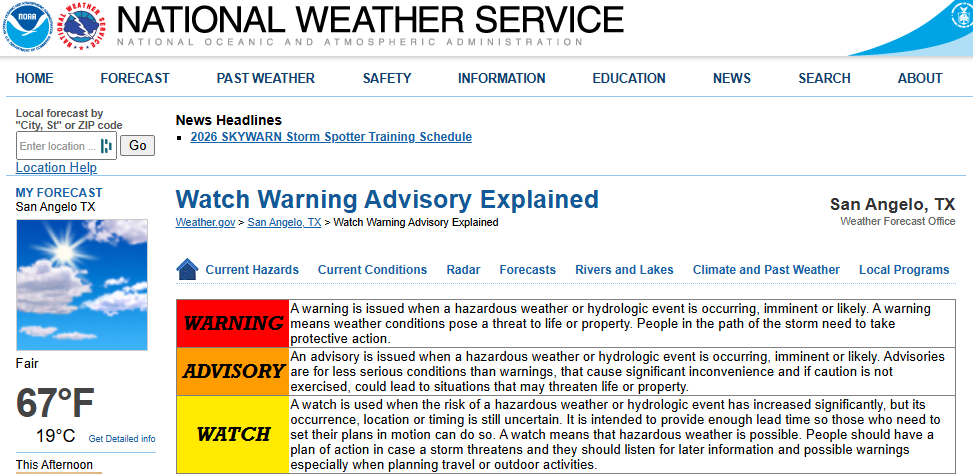
NWS Watch Warning Advisory Explained
Having lived in various coastal cities throughout Florida my entire life, all of which have been subject to direct hits from hurricanes, flooding, & tornados, I can say from experience that only a small portion of the watches resulted in a direct hit/impact on the area it was issued for at the time. Either way, the gist is that when a Watch is issued, the risk of the event is considerably lower than a Warning. I can also say that Watch can turn into a Warning a lot faster than many expect, especially if & when the conditions being monitored change more rapidly than expected.
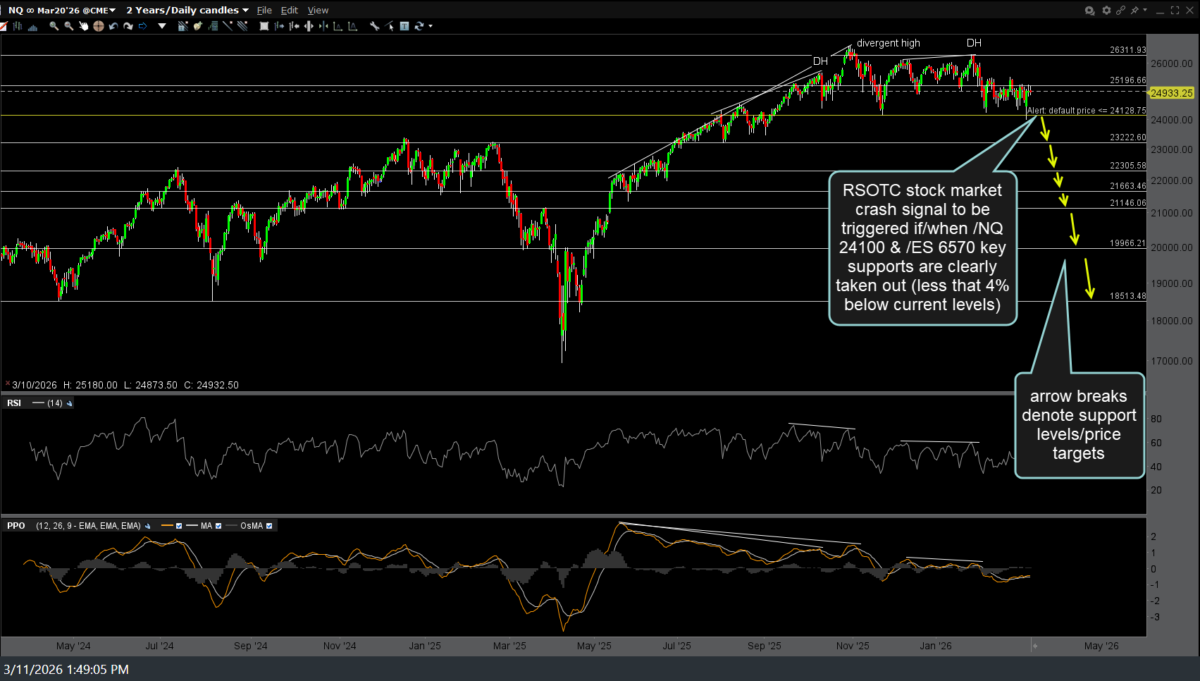
NQ daily March 11th
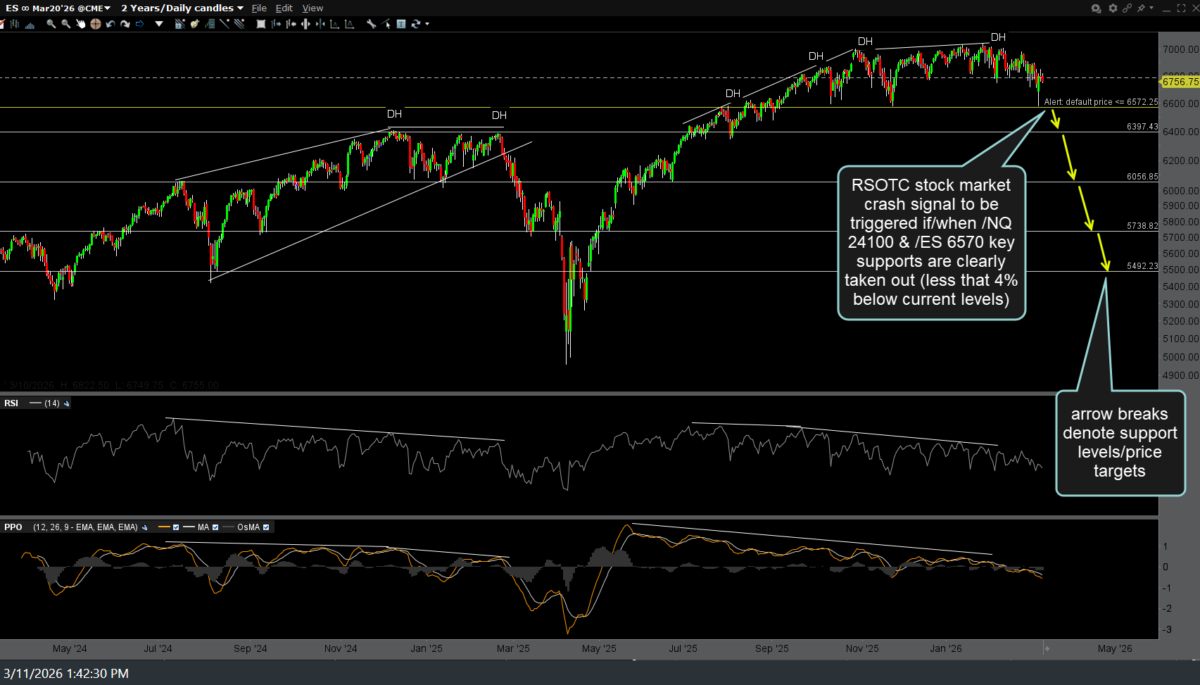
ES daily March 11th
With that being said, upon extensive review of the charts (technicals) as well as other fundamental developments, most of which have been covered extensively in recent videos, I believe that the odds for an imminent (days to weeks) swift & sudden drop in the stock market are significant enough to issue a Stock Market Crash Watch (see the NWS definition above for my analogy & similar plan/preparation for swing traders). The charts of /NQ (Nasdaq 100 futures) and /ES (S&P 500 futures) above show the levels, which, if taken out, would prompt me to bump the advisory up to a Market Crash Warning.
I have covered the comparable levels on QQQ & SPY dozens of times in recent weeks & months (essentially, around 589 & the intersecting 200-day moving averages on QQQ, along with the 652ish support & intersecting 200-day MA’s SPY, i.e., the bottom of the 6-month trading ranges in the major indices.
To reiterate what I said above, just like stock market crashes are extremely rare, with the stock market rising the majority of the time (along with typical corrections on occasion), if I had a nickel for every hurricane watch or warning that never ended up hitting, with conditions & the forecasted path or track causing the storm to change course, I’d be rich (or at least have a lot of nickels).
The same thing holds true with the stock market. As I often say, support is support until & unless broken. Therefore, it is most certainly in the realm of possibility that the stock market holds above those key support levels (or just makes a brief, stop-clearing raid followed by a strong reversal & rally back above), although that is not the most probable scenario at this time, IMO.
If & as anything significant in the technicals and/or the fundamentals changes, which alters my outlook & expectation that the stock market will likely trigger the aforementioned sell signals AND drop substantially from there, I will do my best to communicate my thoughts asap. As of now, it’s just more of the same with the major indices as they grind around aimlessly in a sideways range, building energy like a coiled spring, which is likely to pop one way or the other, sooner than later.
Some, but far from all, of the things I continue to monitor closely are:
- XLF (financial sectors) and the various sub-sectors within the financial sector, including but not limited to the private credit & private equity sectors, regional banks, broker-dealers, etc.
- Treasury yields, mortgage rates, junk bonds & credit spreads (Treasuries vs. junk bond yields), floating-rate funds (which can indicate additional stresses in the credit markets)
- All of the Magnificent 8 market-leading stocks (collectively)
- Crude oil (and to a lesser extent, natural gas)
- and much more, as per recent videos