
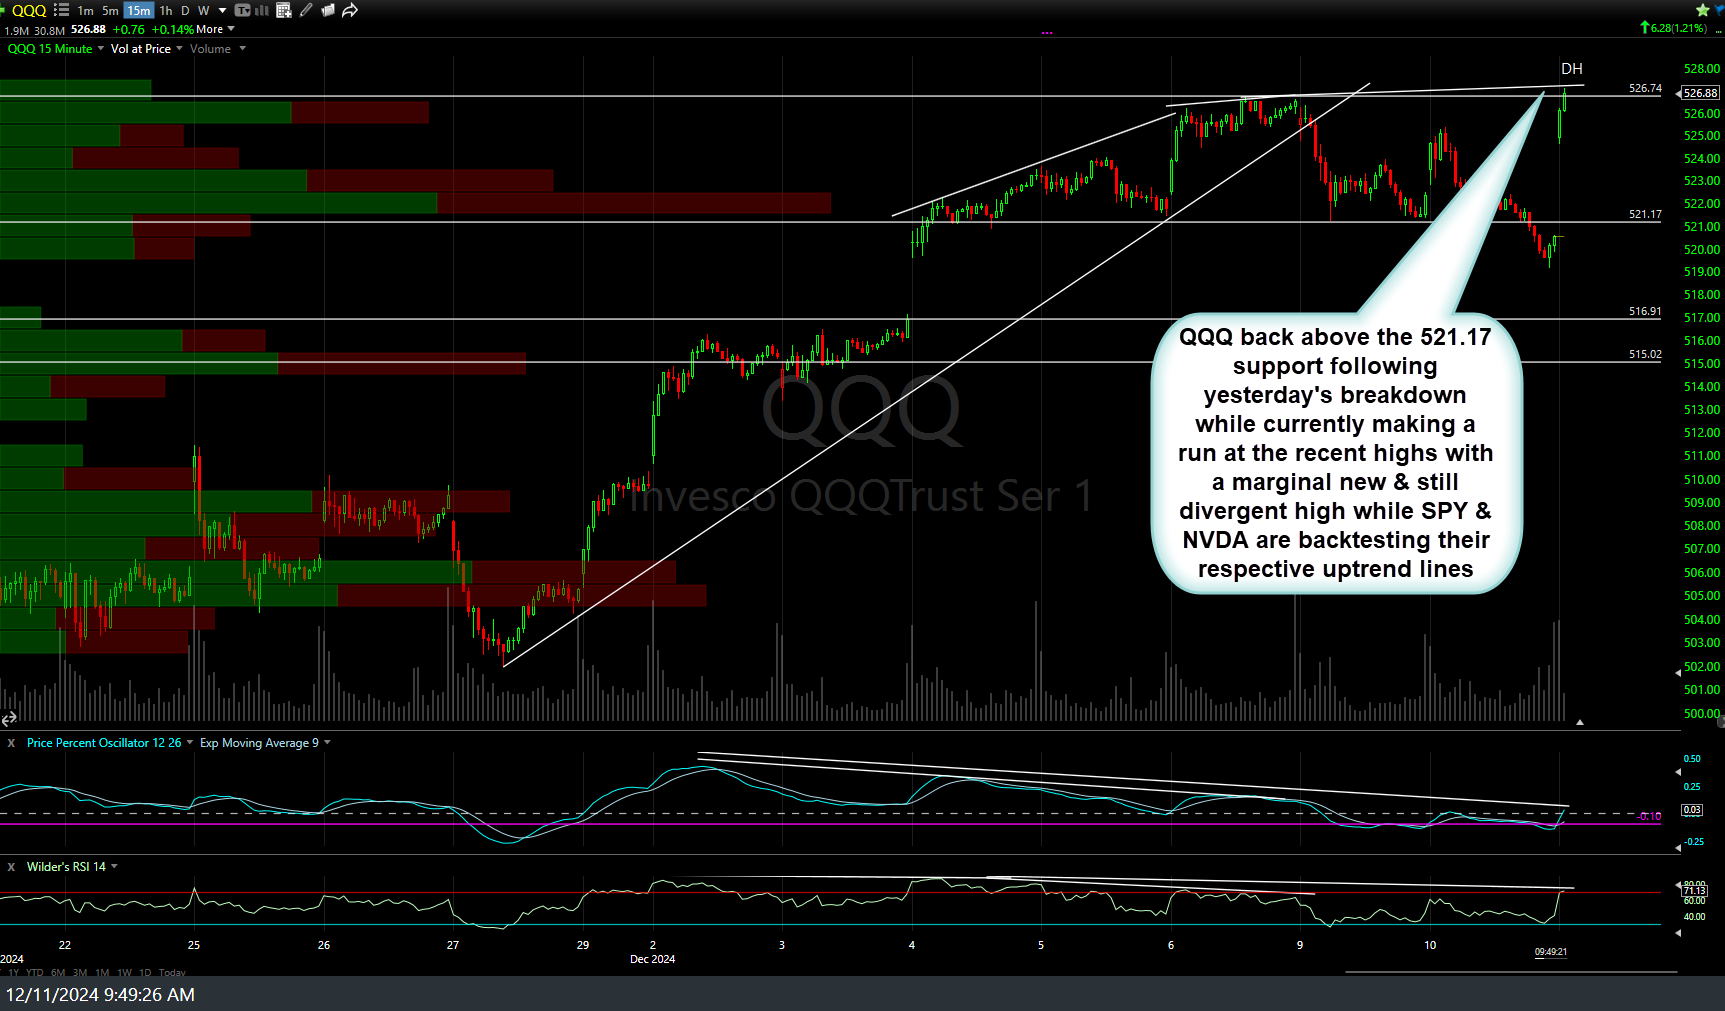
QQQ snapped back above the 521.17 support following yesterday’s breakdown while currently making a run at the recent highs with a marginal new & still divergent high while SPY & NVDA are backtesting their respective uptrend lines. 15-minute chart below.
QQQ 60m Dec 11th
SPY backtesting recently broken wedge from below, thereby offering an objective add-on or new short entry although I’d prefer to see QQQ back below 521.17 first before taking (or continuing to hold) any new shorts.
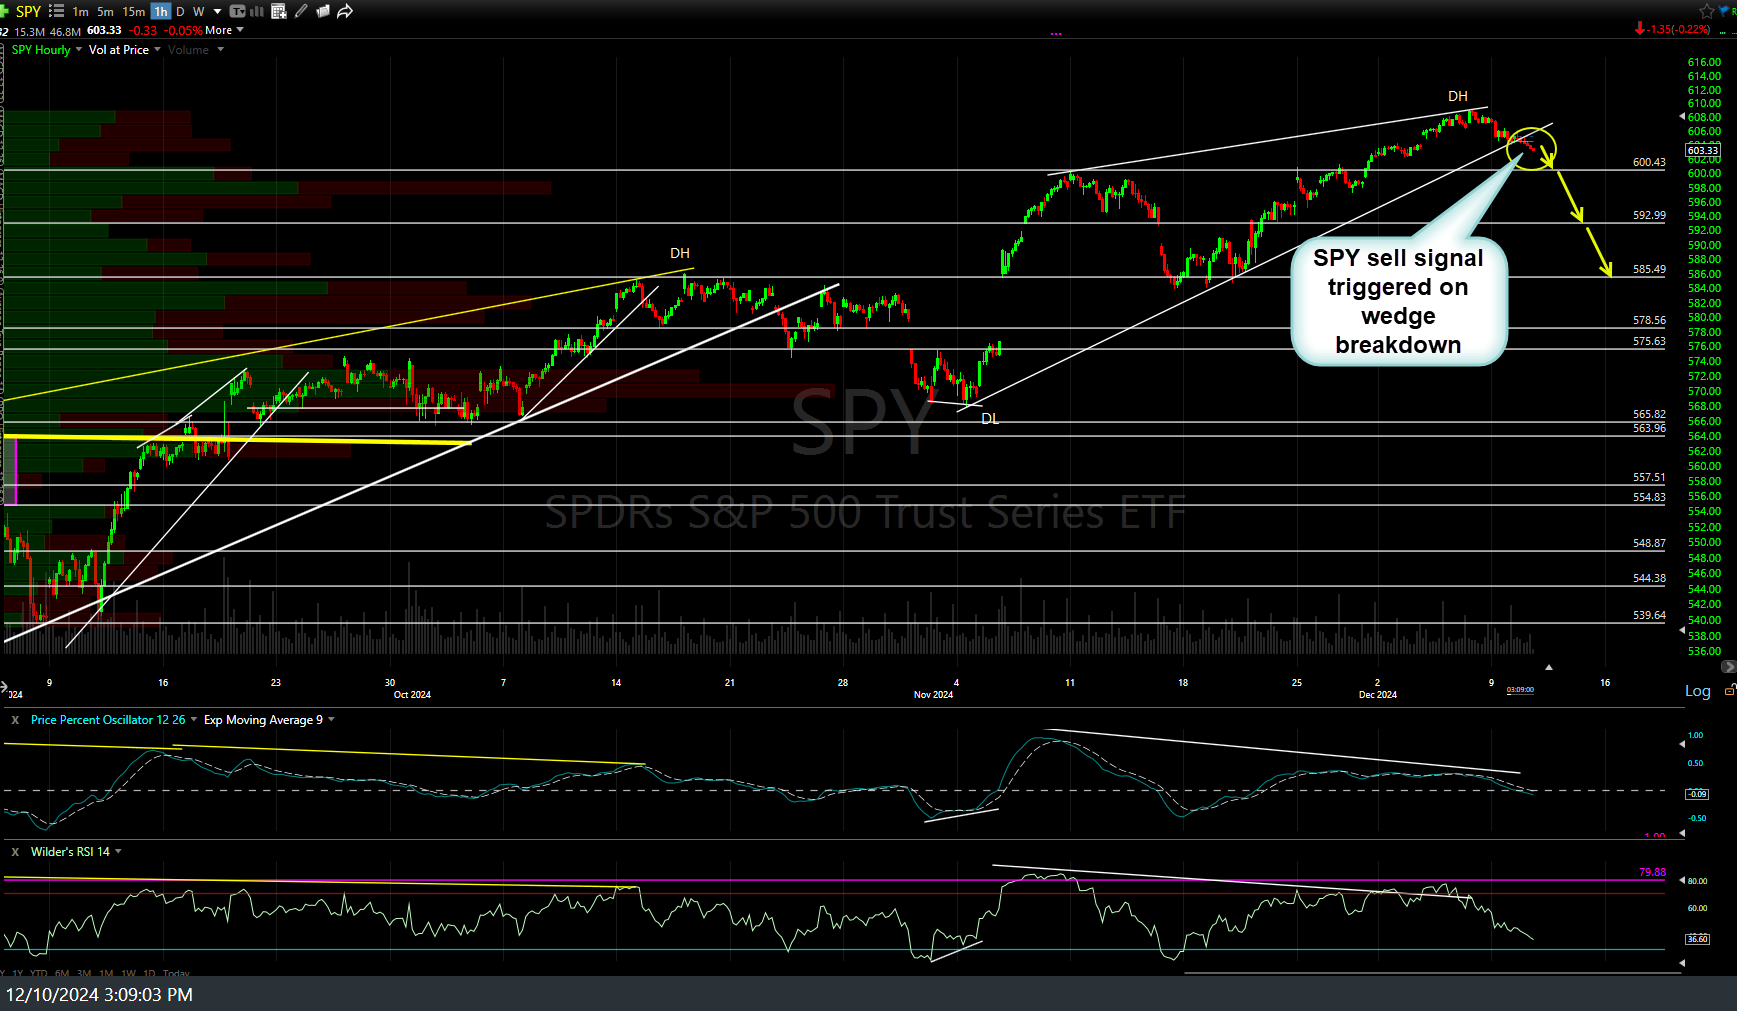
SPY 60m 2 Dec 10th
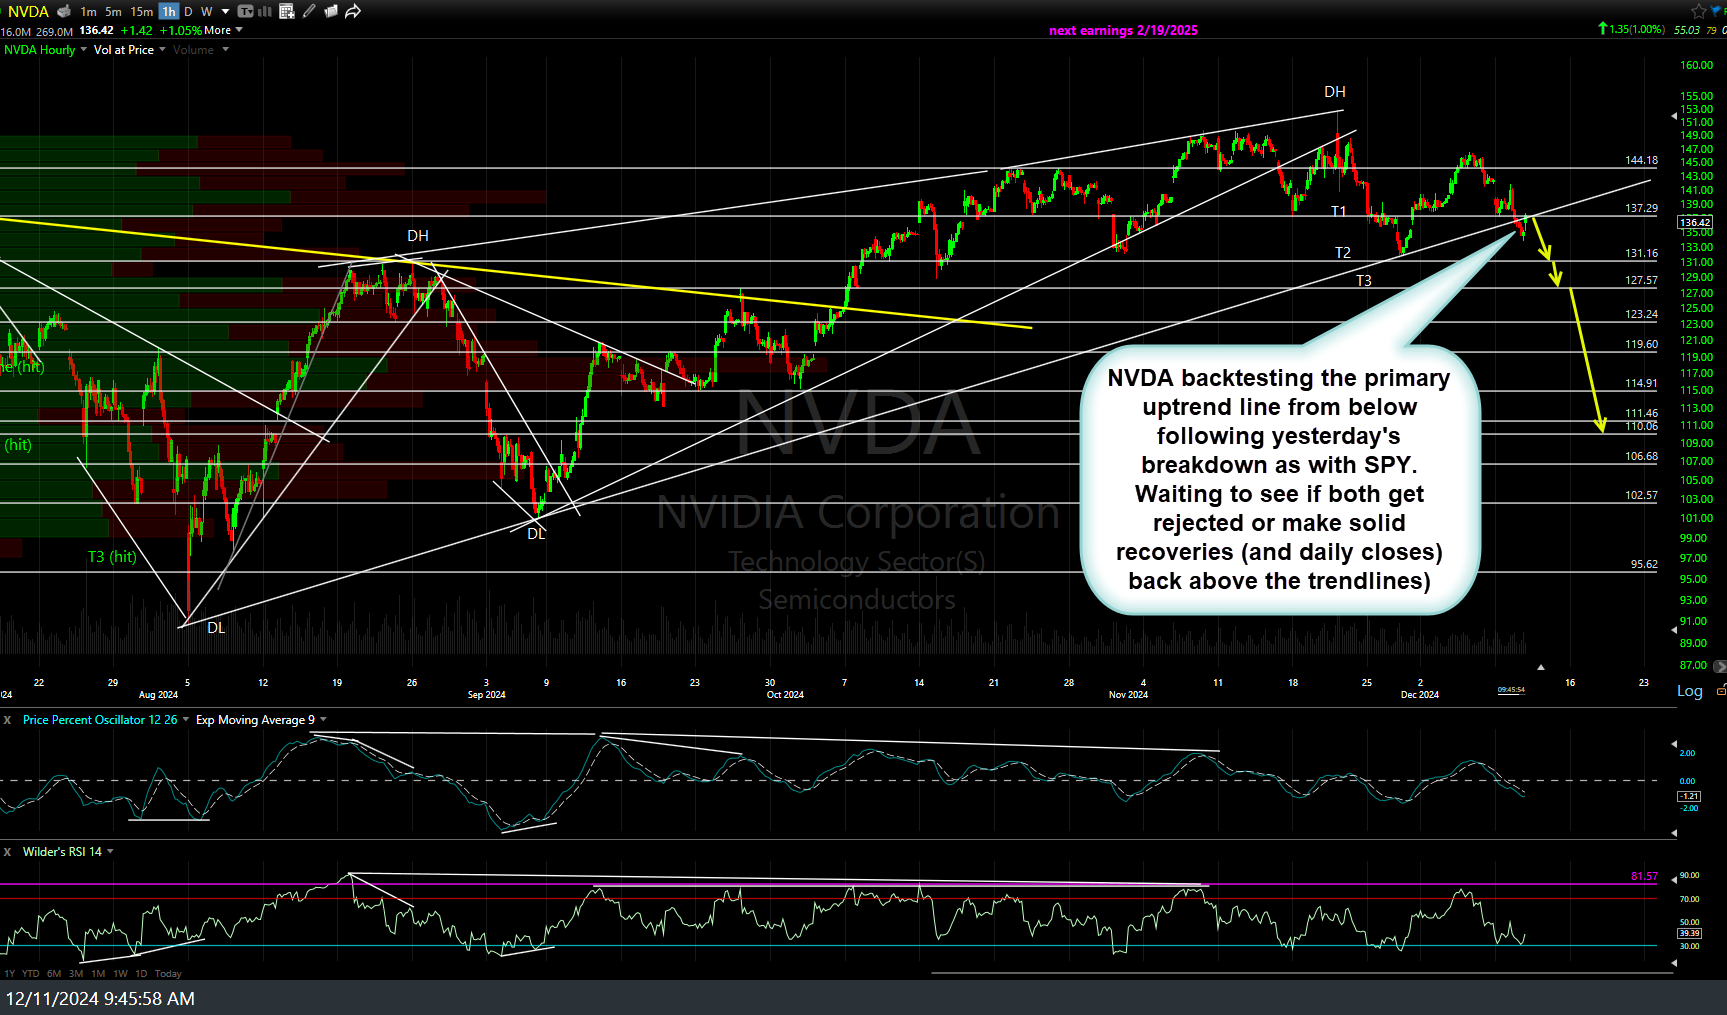
NVDA backtesting the primary uptrend line from below following yesterday’s breakdown as with SPY. Waiting to see if both get rejected or make solid recoveries (and daily closes) back above the trendlines). 60-minute chart below.
NVDA 60m Dec 11th
With the exception of QQQ (15-minute chart), yesterday’s sell signals were based on the 60-minute time frames on SPY & NVDA and as such, my preference is to wait until either the first 60-minute candlestick close (11 am as the first candle of the day on the 60-minute chart at 10 am only shows the first 30 minutes of trading) or a daily close to see if yesterday’s sell signals stick (will require an intraday reversal) or prove to be whipsaws with SPY & NVDA closing solidly back above their respective uptrend lines.