
No change in the technical posture of the Nasdaq 100 as QQQ is still testing the primary downtrend line off the mid-July highs with the 372 resistance a likely reversal point, should the powers-that-be run a stop-clearing break above it before any significant pullback. Same pullback targets & primary scenario (yellow arrows) but I’ve added that alternative (false breakout) scenario (a brief pop above the trendline to blow out the stops & suck in some more longs before reversing around 372) with the red arrows (with the same pullback targets) on the updated 60-minute chart below.
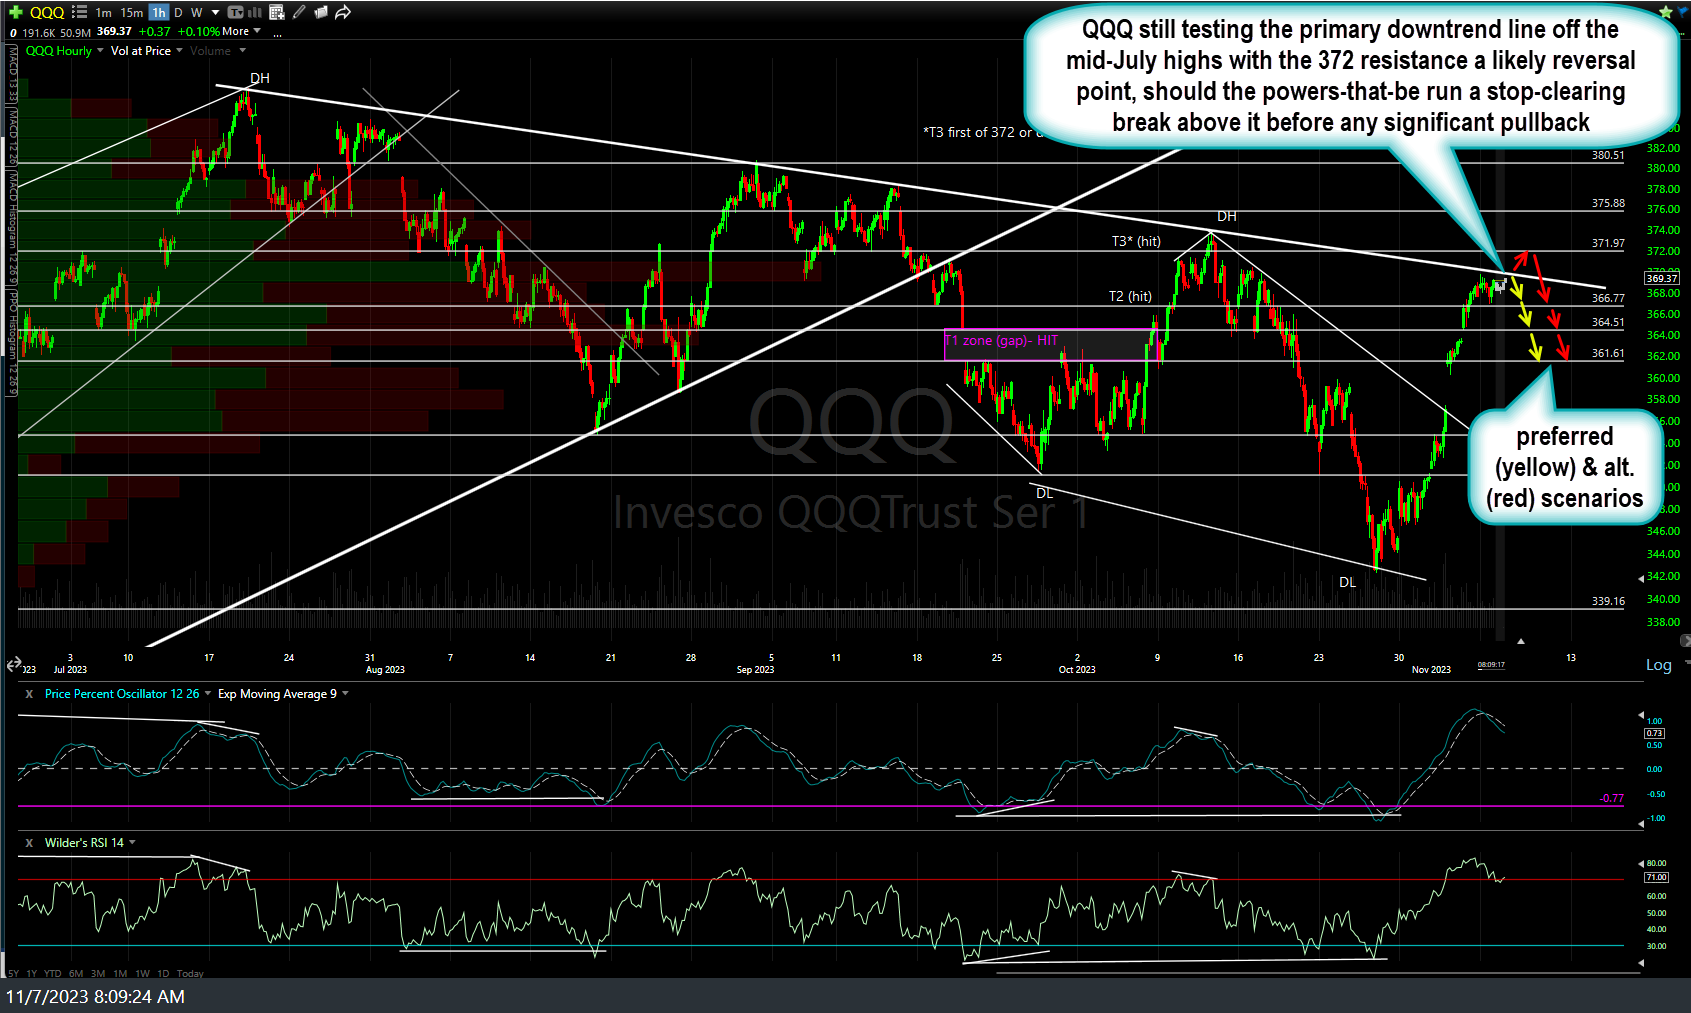
QQQ 60m Nov 7th
Again, if & how far the stock market pulls back will be largely dependent on where Treasury yields go from here so I’ll follow-up with some additional charts in the comment section below and/or a new post later today.