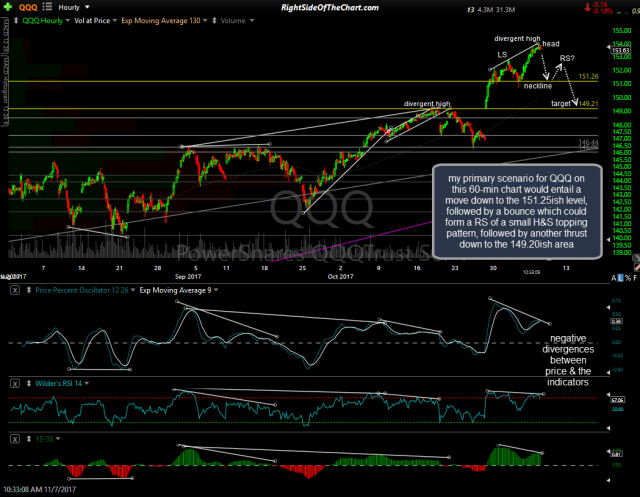
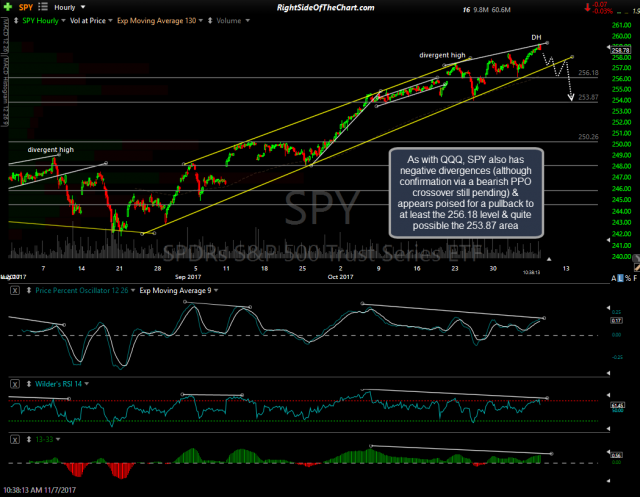
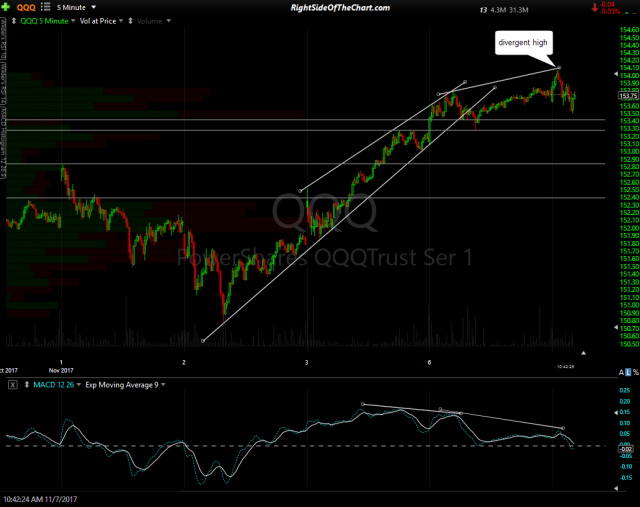
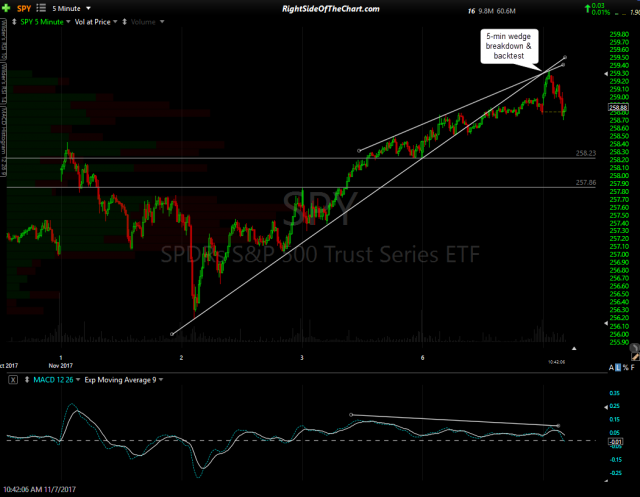
My primary scenario for QQQ on this 60-min chart would entail a move down to the 151.25ish level, followed by a bounce which could form a RS of a small H&S topping pattern, followed by another thrust down to the 149.20ish area. As with QQQ, SPY also has negative divergences (although confirmation via a bearish PPO crossover still pending) & appears poised for a pullback to at least the 256.18 level & quite possible the 253.87 area. 60-minute charts of QQQ & SPY followed by the 5-minute charts which help to confirm the near-term case for a correction & confirmation of the pending 60-minute divergences.
- QQQ 60-min Nov 7th
- SPY 60-min Nov 7th
- QQQ 5-min Nov 7th
- SPY 5-min Nov 7th


