
The 60-minute chart of QQQ below shows the nearby support & resistance levels to watch with the bottom of the 6/17-21 gap around 275.25 about the only support stand between the Q’s & the previous/52-week low with the previous low also key support on the daily & weekly charts (T3).
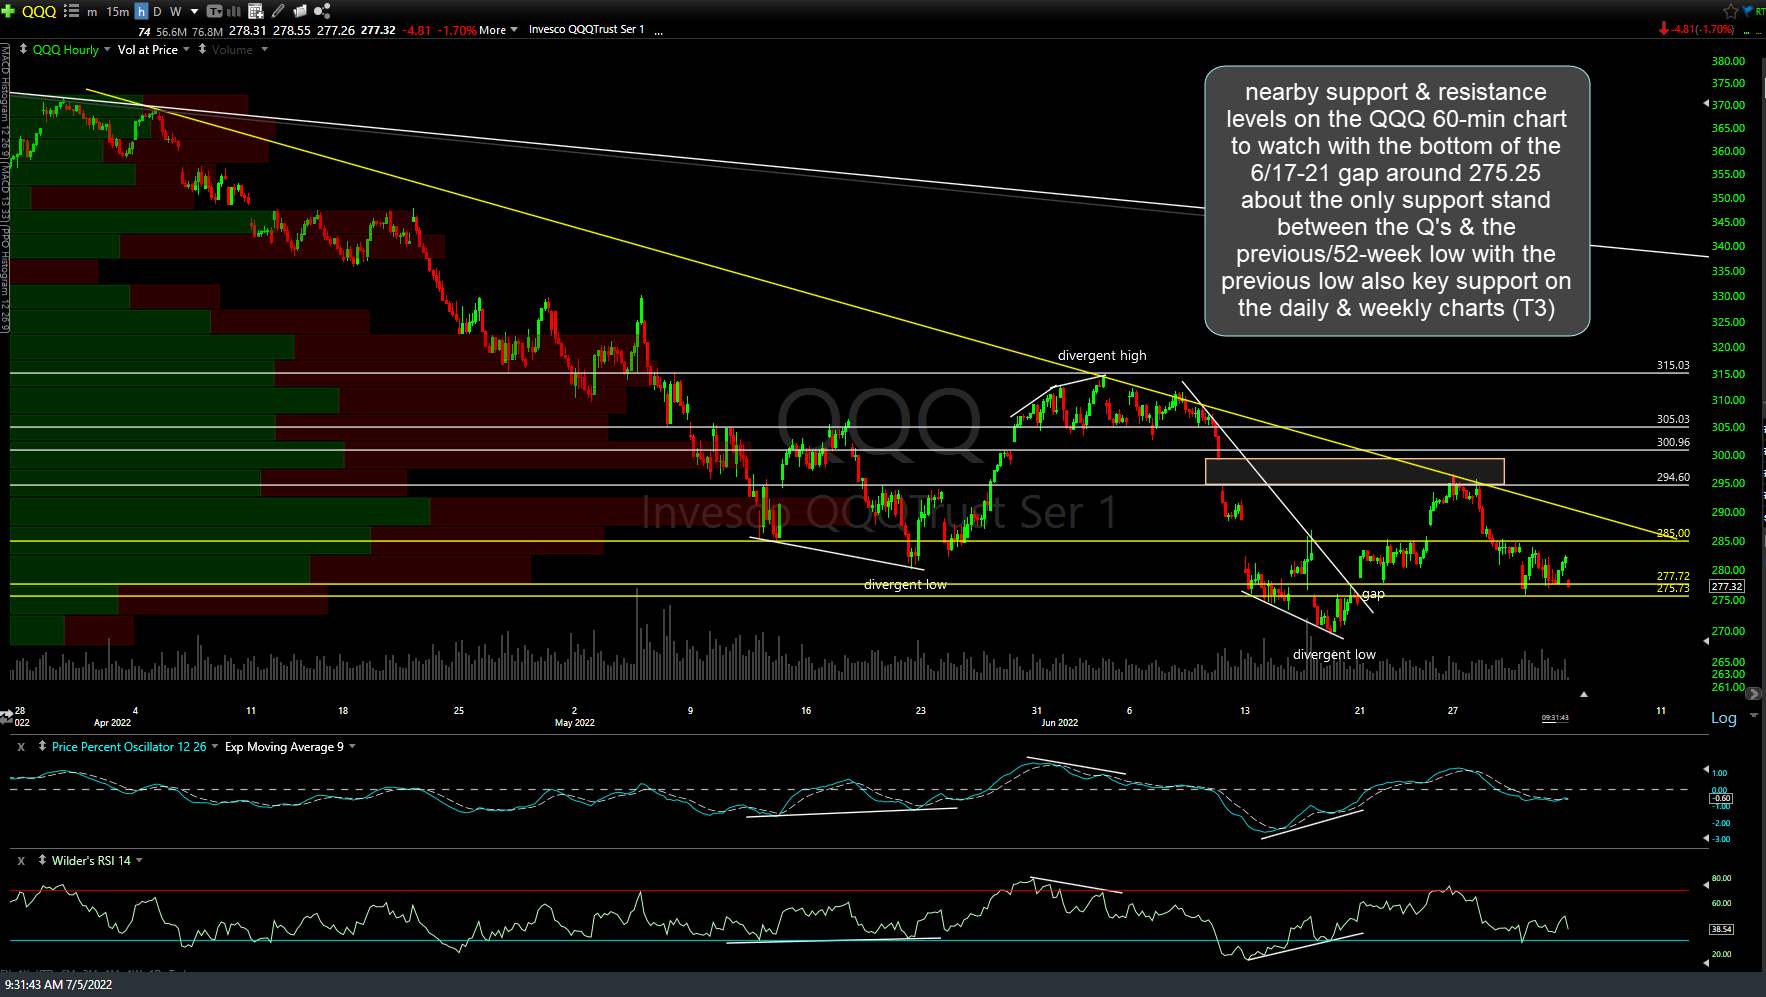
QQQ 60m July 5th
Likewise, the 60-minute chart below highlights the nearby support & resistance levels on the SPY 60-minute chart to watch as we head into the abbreviated trading week. Keep in mind that this holiday week is typically marked by below-average volume as many traders are on vacation & as such, whipsaws tend to be more common.
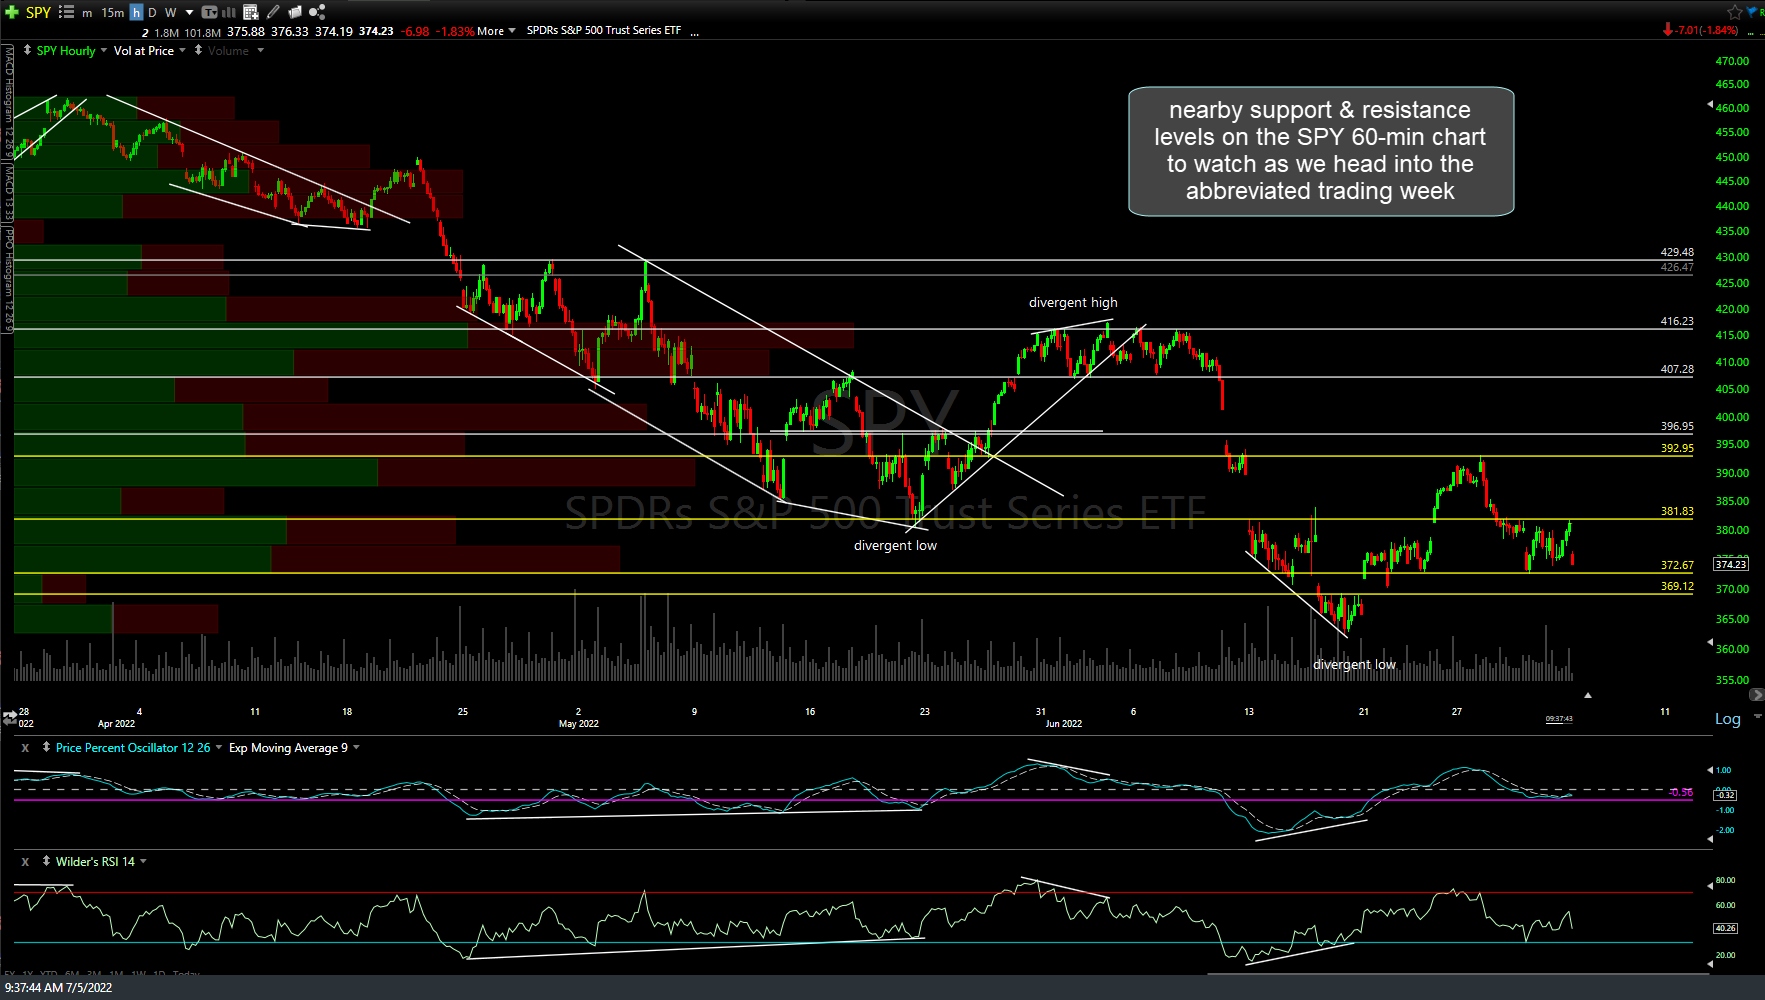
SPY 60m July 5th