
Nearby resistance levels on the 60-minute chart of QQQ are the downtrend line off the early Jan highs (where QQQ closed yesterday) followed by the 352 & then 356.80ish resistance levels. If the rally off last week’s divergent low is simply a counter-trend rally within a larger downtrend, any of these levels could prove to be the end-point for that bounce.
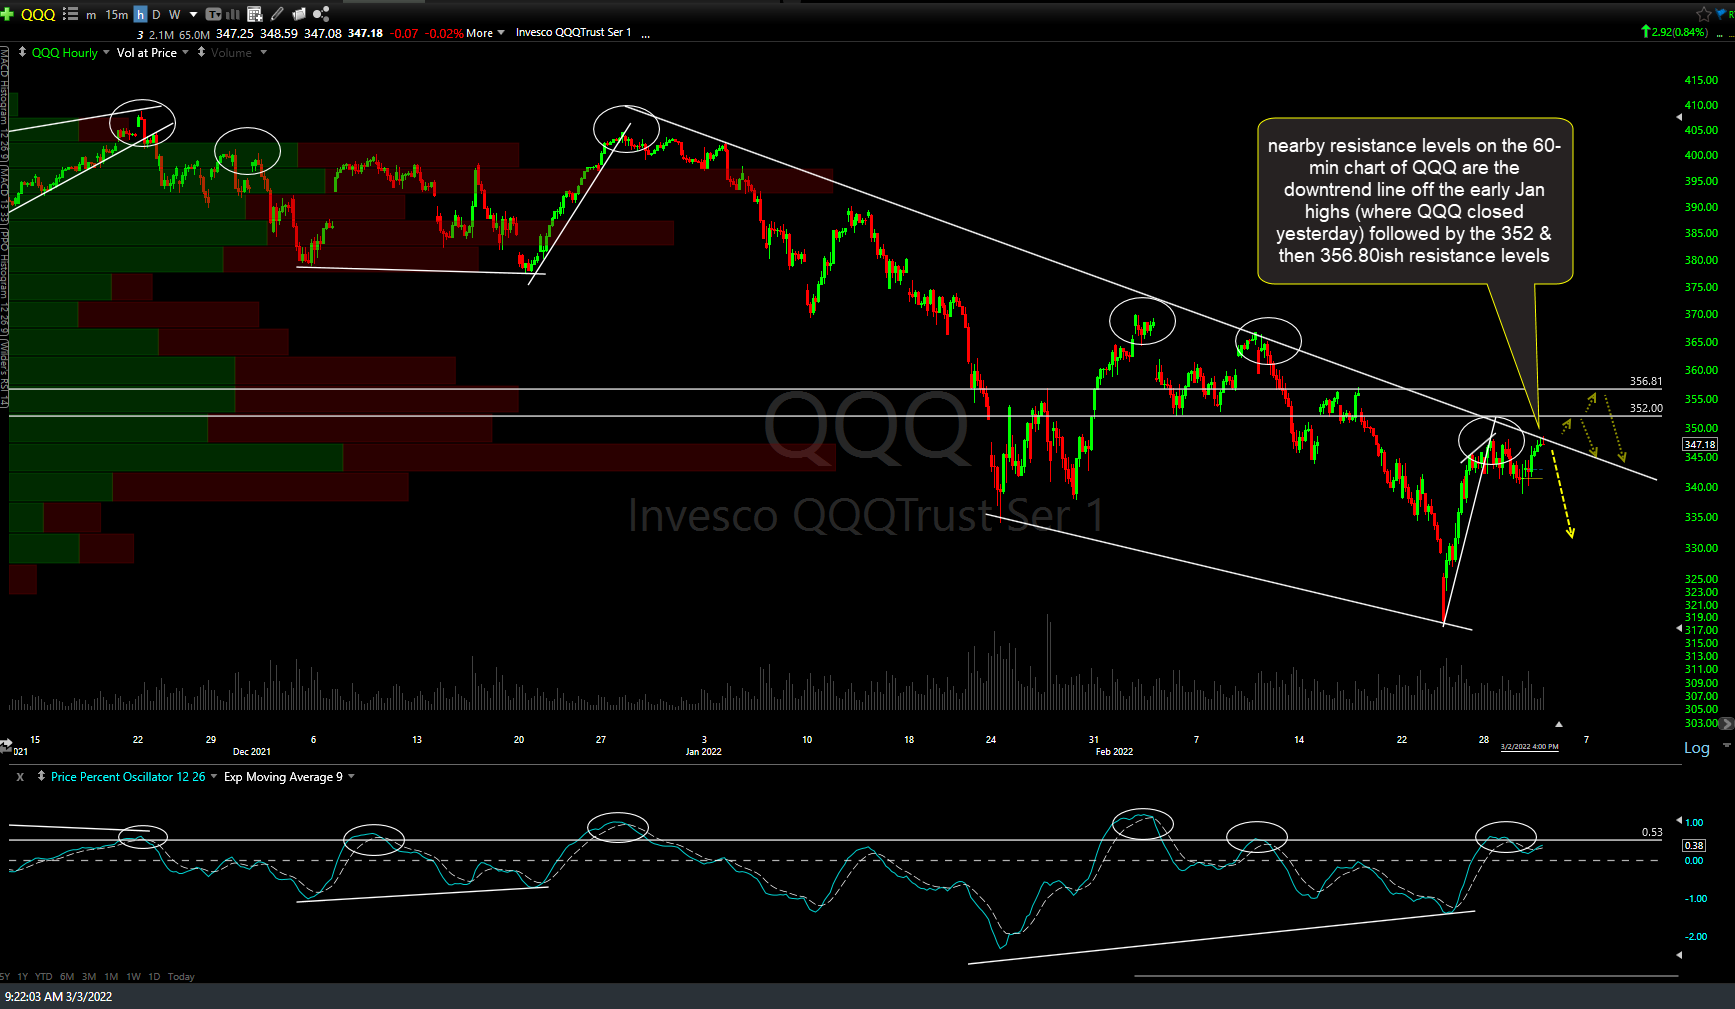
QQQ 60m March 3rd
Should QQQ solidly move back above these resistance levels, each cross back above the previous reaction highs over the past couple of months, as well as the key 200-day moving averages on the daily time frame, would increase the odds that the 22% drop off the November highs was a correction that is over (especially if the 200-day MA’s are regained on a solid weekly closing basis vs. an intraweek pop above). As of now, there is very little technical evidence that is the case & as such, I continue to view bounces back into resistance as objective shorting opps.
Nearby resistance levels on the SPY 60-minute chart are 443.50 & the intersecting downtrend line followed by the 451.40ish level. 60-minute chart below.
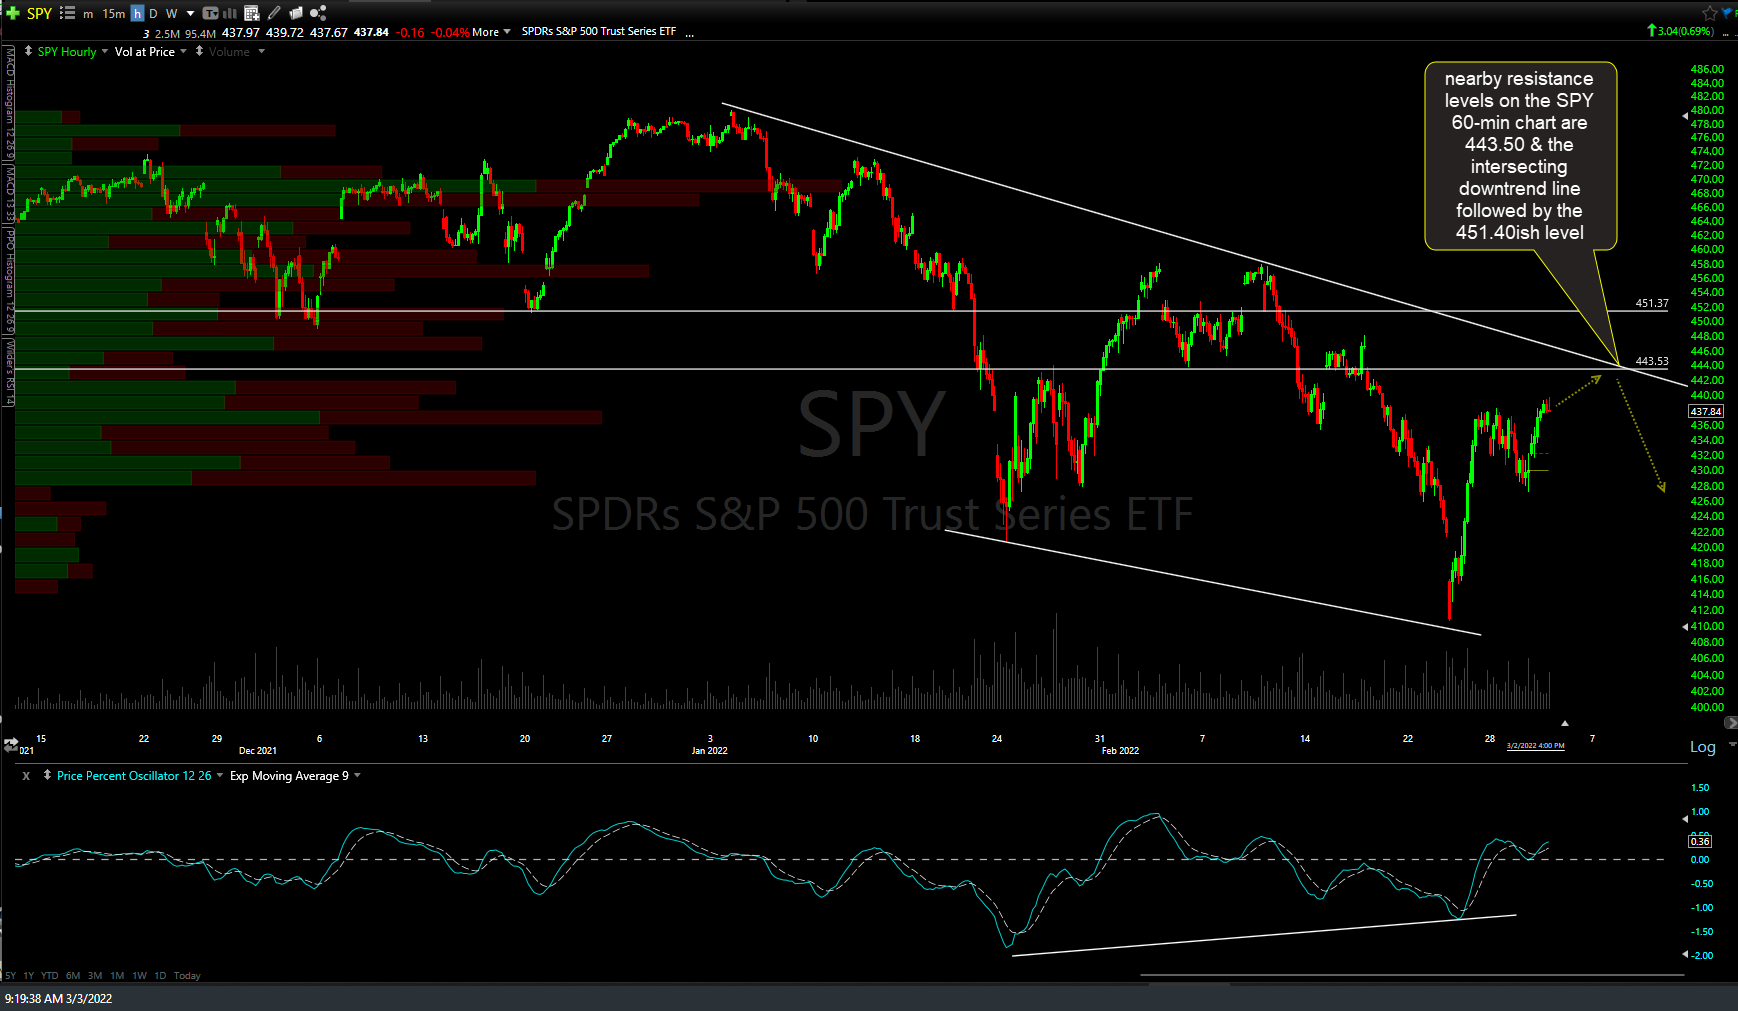
SPY 60m March 3rd