
SPY (S&P 500 tracking ETF) is current poised to gap above its Golden downtrend line with any of the horizontal resistance levels shown on this 15-min chart as potential bounce targets with 271.54 likely to produce a reaction if & when hit. These 15-minute charts reflects prices as of yesterday’s close, see futures charts below for current prices.
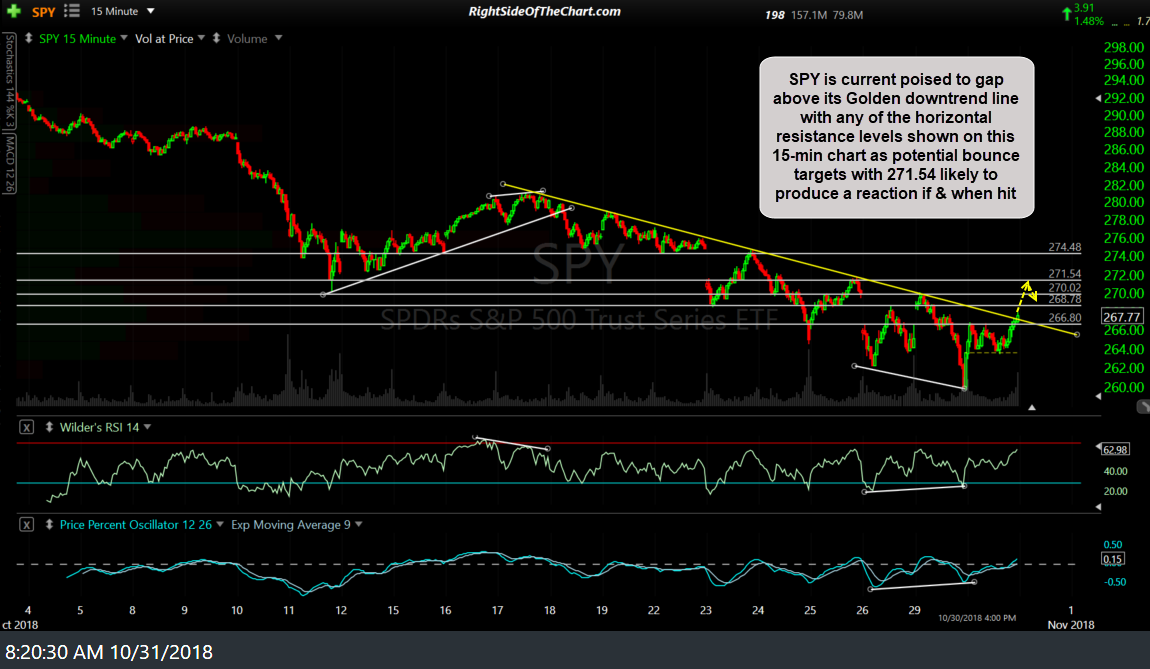
SPY 15-min Oct 30th close
The Golden Downtrend line + horizontal price resistance levels show on this 15-min chart are potential near-term bounce targets for QQQ (Nasdaq 100 Tracking ETF) with a likely reaction at the downtrend line if & when hit.

QQQ 15-min Oct 30th close
/ES is testing the upper-most downtrend line in the morning trading session. Potential targets/resistance levels shown with 2750.50 a likely near-term target. 60-minute chart:

ES 60-min Oct 31st
/NQ is currently testing downtrend resistance with the next buy signal to come on an impulsive breakout above the TL. 60-minute chart:
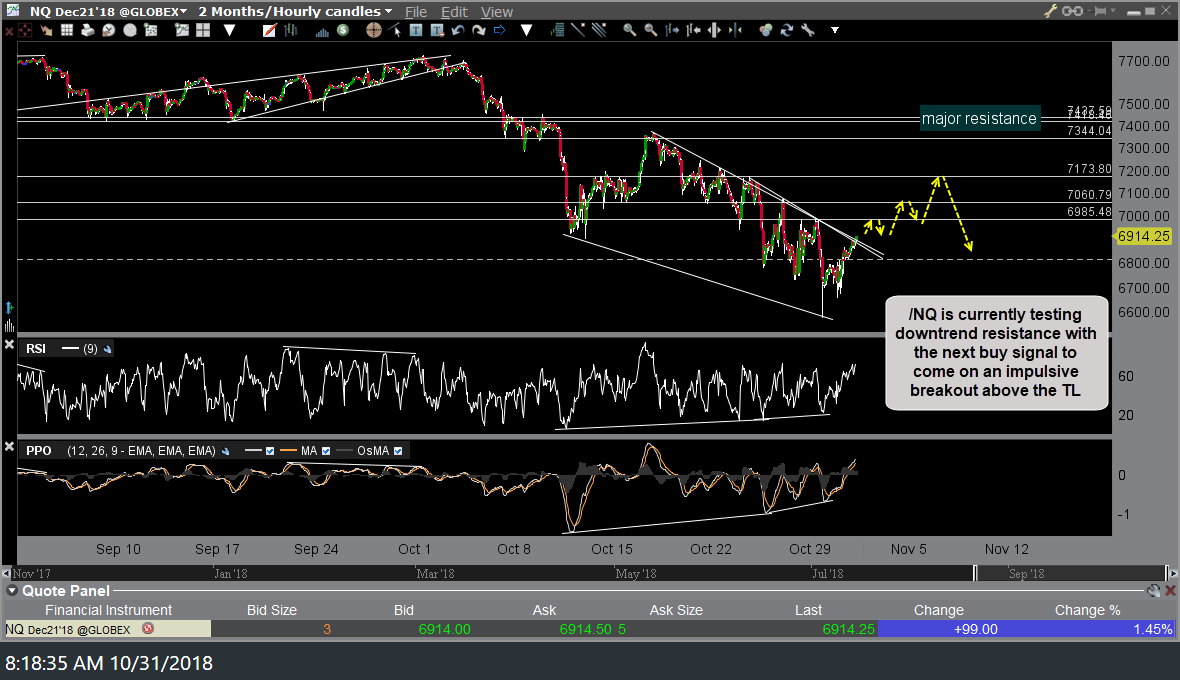
NQ 60-min Oct 31st/ES