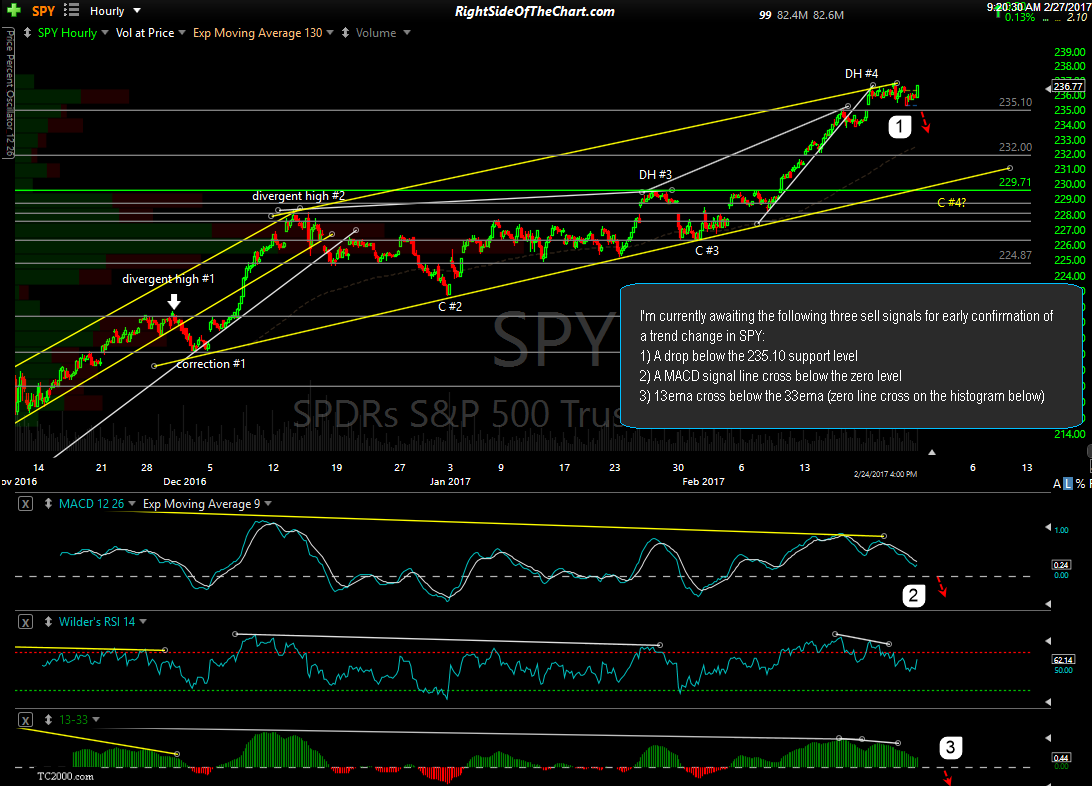
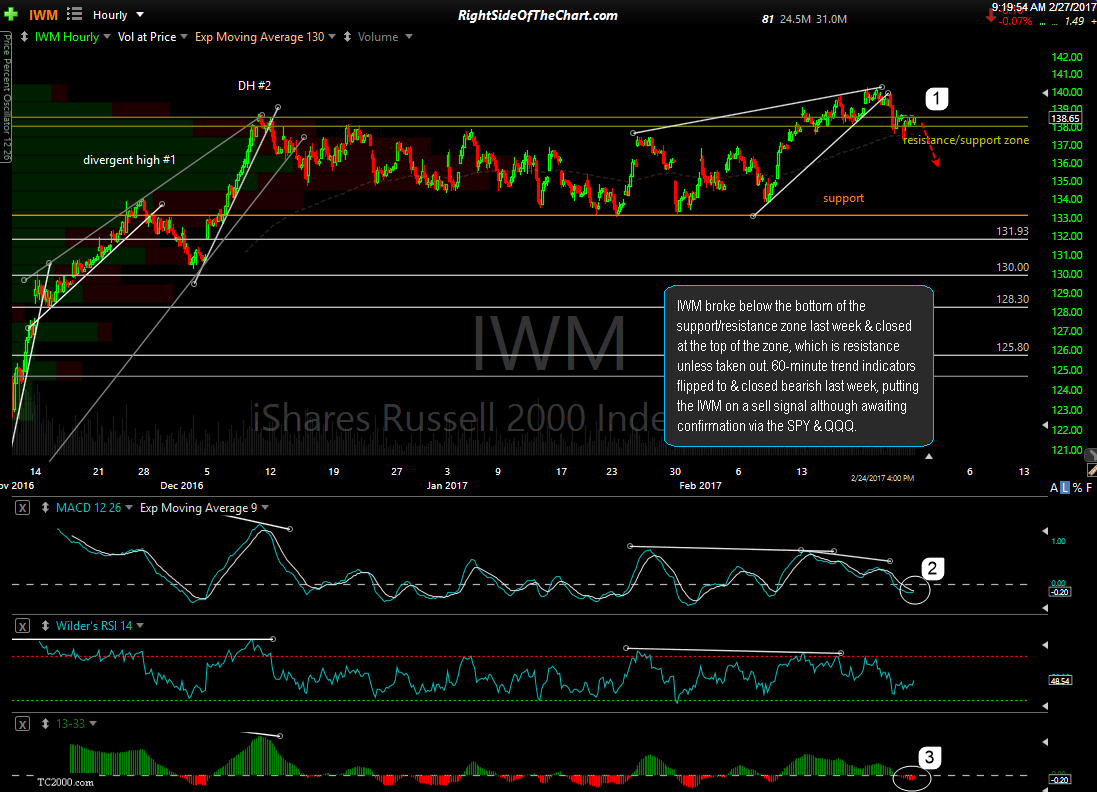
Sorry for the late start. I had planned on getting this update out earlier but apparently NVIDIA must have found out I was short their company stock (NVDA) as woke up to only a single monitor working today (which is essentially flying blind when I don’t have the use of multiple monitors). ;-) Took a while to troubleshoot, download & re-install the drivers for the graphics cards but I’m back to business now. Here’s a quick look at how the markets closed last week & what I’ll be watching for this week. These are all 60-minute charts as of Friday’s close.
QQQ has already broken down below the yellow minor uptrend line last week, triggering the first of 3 sell signals. Now awaiting a MACD signal line cross below the zero level & a bearish cross of the 13/33-ema pair (histogram).
IWM broke below the bottom of the support/resistance zone last week & closed at the top of the zone, which is resistance unless taken out. 60-minute trend indicators flipped to & closed bearish last week, putting the IWM on a sell signal although awaiting confirmation via the SPY & QQQ.
As of now, my call that the correction would begin on Thursday could still very well play out as both the SPY & QQQ have moved lower since peaking with Thursday’s highs (with the less significant IWM so far peaking on Tuesday of last week). Now awaiting the sell signal highlighted above to help firm up that call & increase the odds that a correction in the U.S. stock market is now most likely underway.


