
I just posted the first chart below, along with the following comments, in the comment section below the previous post (with video) about 25-minutes ago:
QQQ has been dancing on the trendline most of today with a breakdown, followed by impulsive selling, likely to come soon as we head into the final hour of trading.
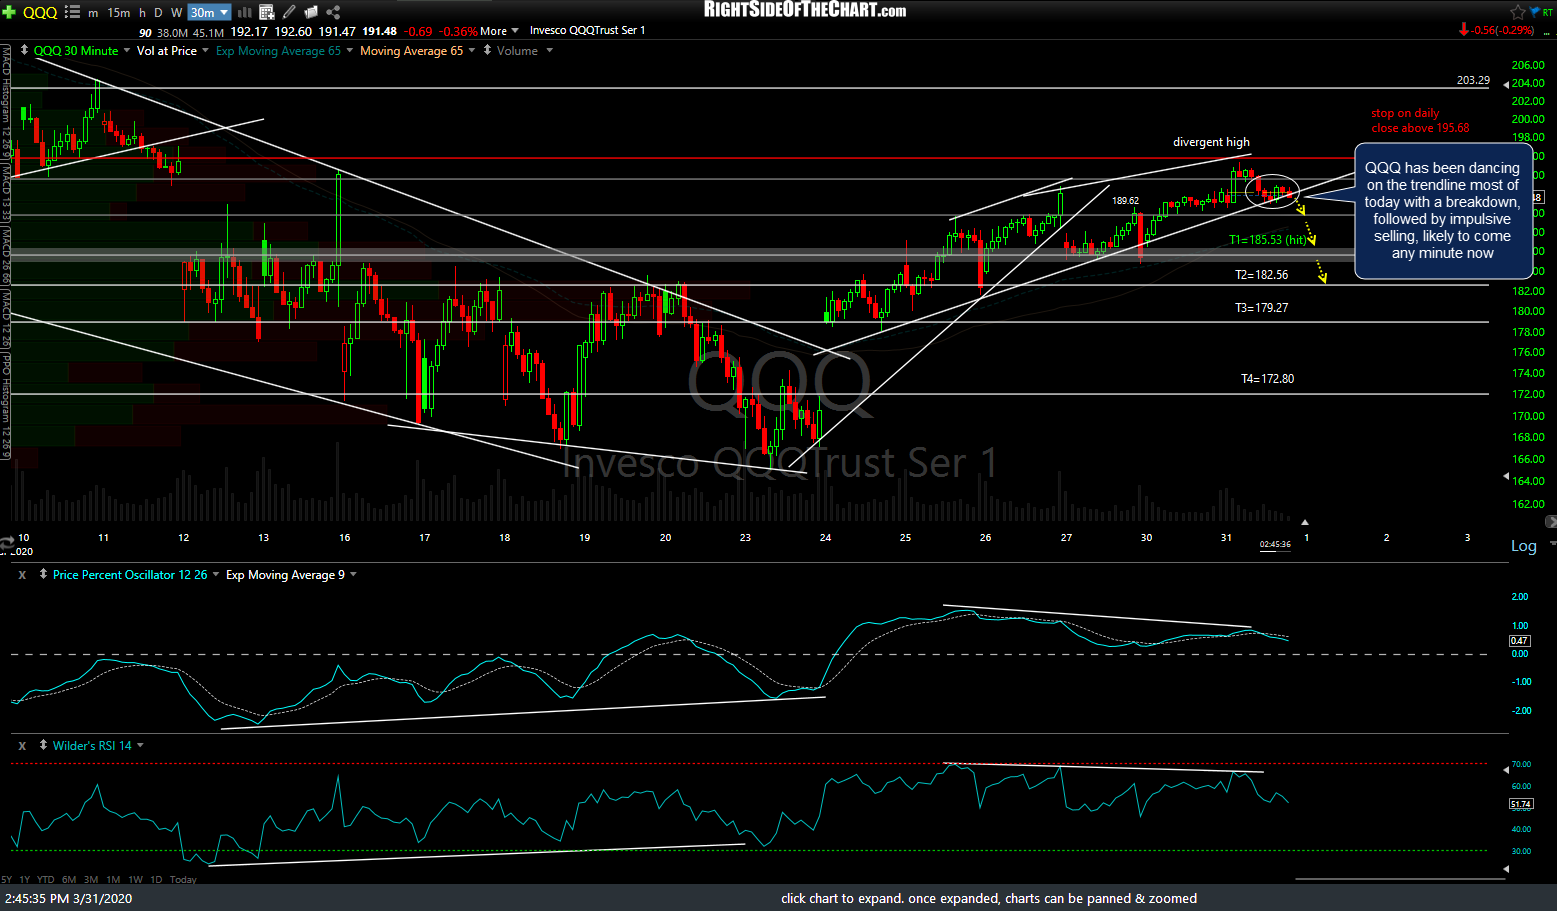
QQQ 30m 2 March 31st.png
We now have the sell signal with an impulsive break below the uptrend line/wedge pattern which should bring QQQ down to at least the 189.69 support before the close in about 40-minutes & quick possibly back down to the 185.50ish support which is just below the first price target that was already hit on Friday shortly after the original entry on the trade. When/if the 185.50 support is taken out with conviction, that should open the door for a continued move to T2 & so on & so forth (i.e.- a solid break of T2 opens the door to T3….). Once again, this breakdown below the trendline offers another objective new short entry or add-on to an existing short position. Updated 30-minute chart below.
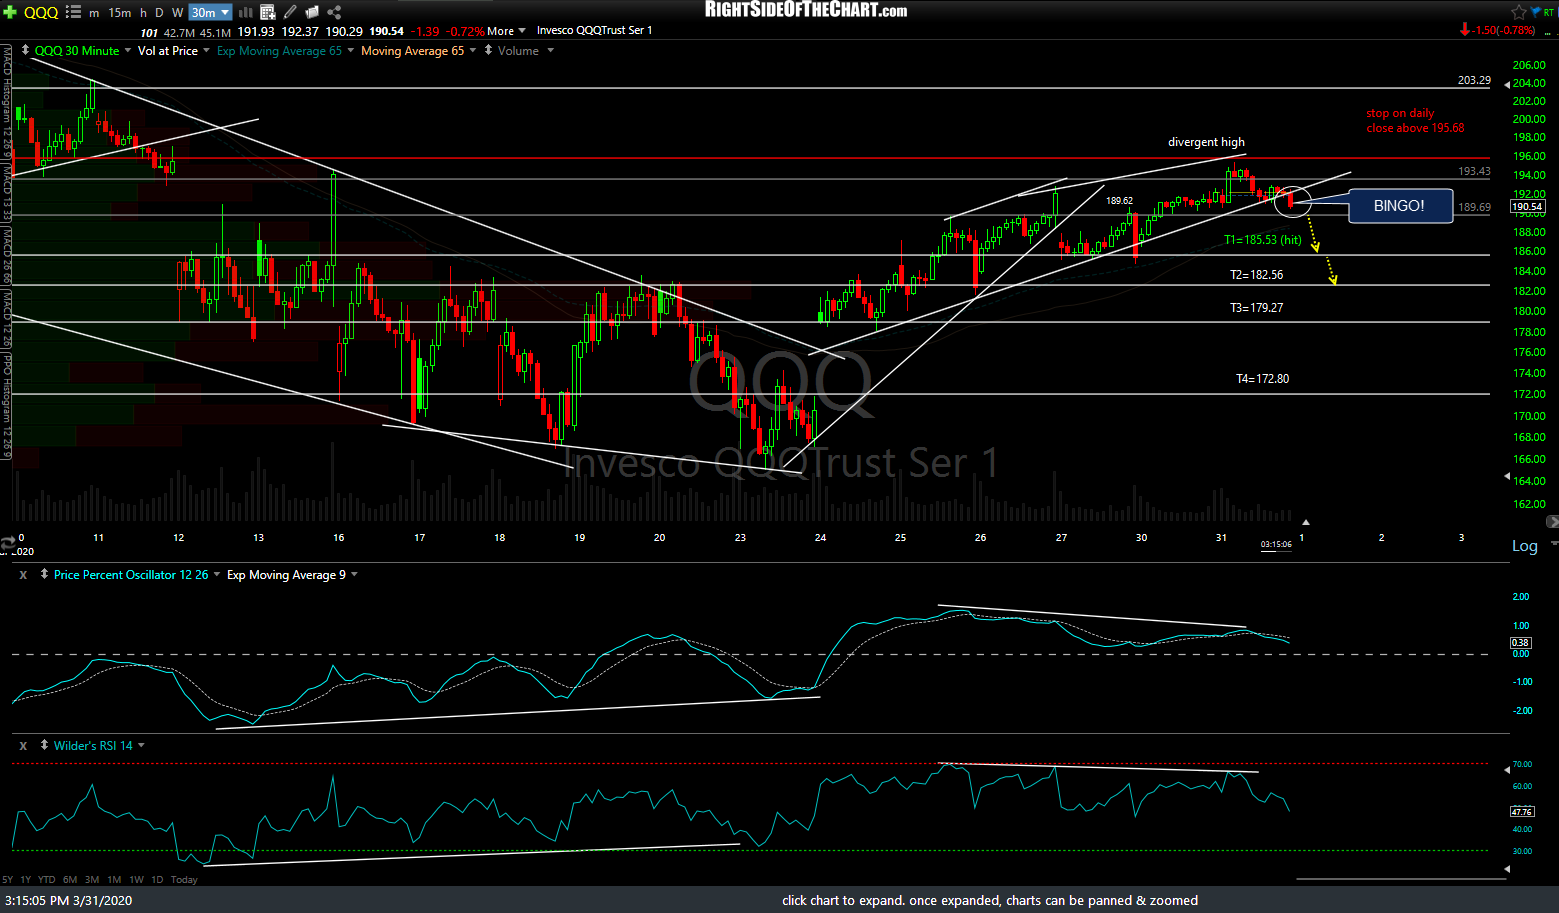
QQQ 30m 3 March 31st