
Both QQQ & SPY broke down & closed below their respective 60-minute uptrend lines yesterday, thereby triggering near-term sell signals on the US equity markets. The 60-minute chart below lays out my preferred (orange) and alternative (yellow) scenarios. My alternative scenario has a maximum downside target at this time of the 163 area although I’m leaning towards this pullback ending around the 168-169ish support zone as of now, which is my preferred scenario.
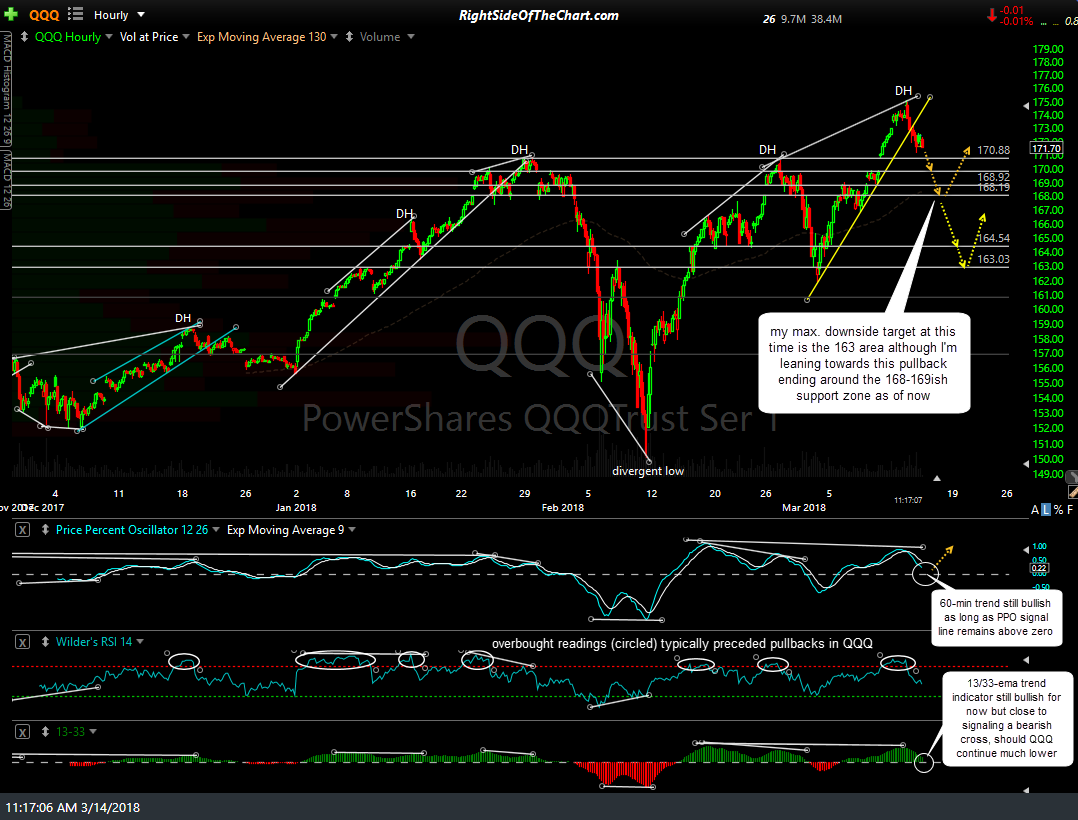
QQQ 60-min March 14th
Should QQQ mount a lasting reversal at or just above the 170.88ish level, which is support defined by the January & February reaction highs plus the top of gap from the March 9th breakout to new all-time highs, that would be quite bullish, indicating that there is still more buyers than sellers at this time although I highly favor at least a backfill of the March 8/9th gap, at minimum.