
As I suspect Halloween may come a bit early for the stock market this year, the 60-minute chart below list some near-term price targets while the daily chart covered in recent videos (including yesterday’s) still shows my intermediate-term price targets.
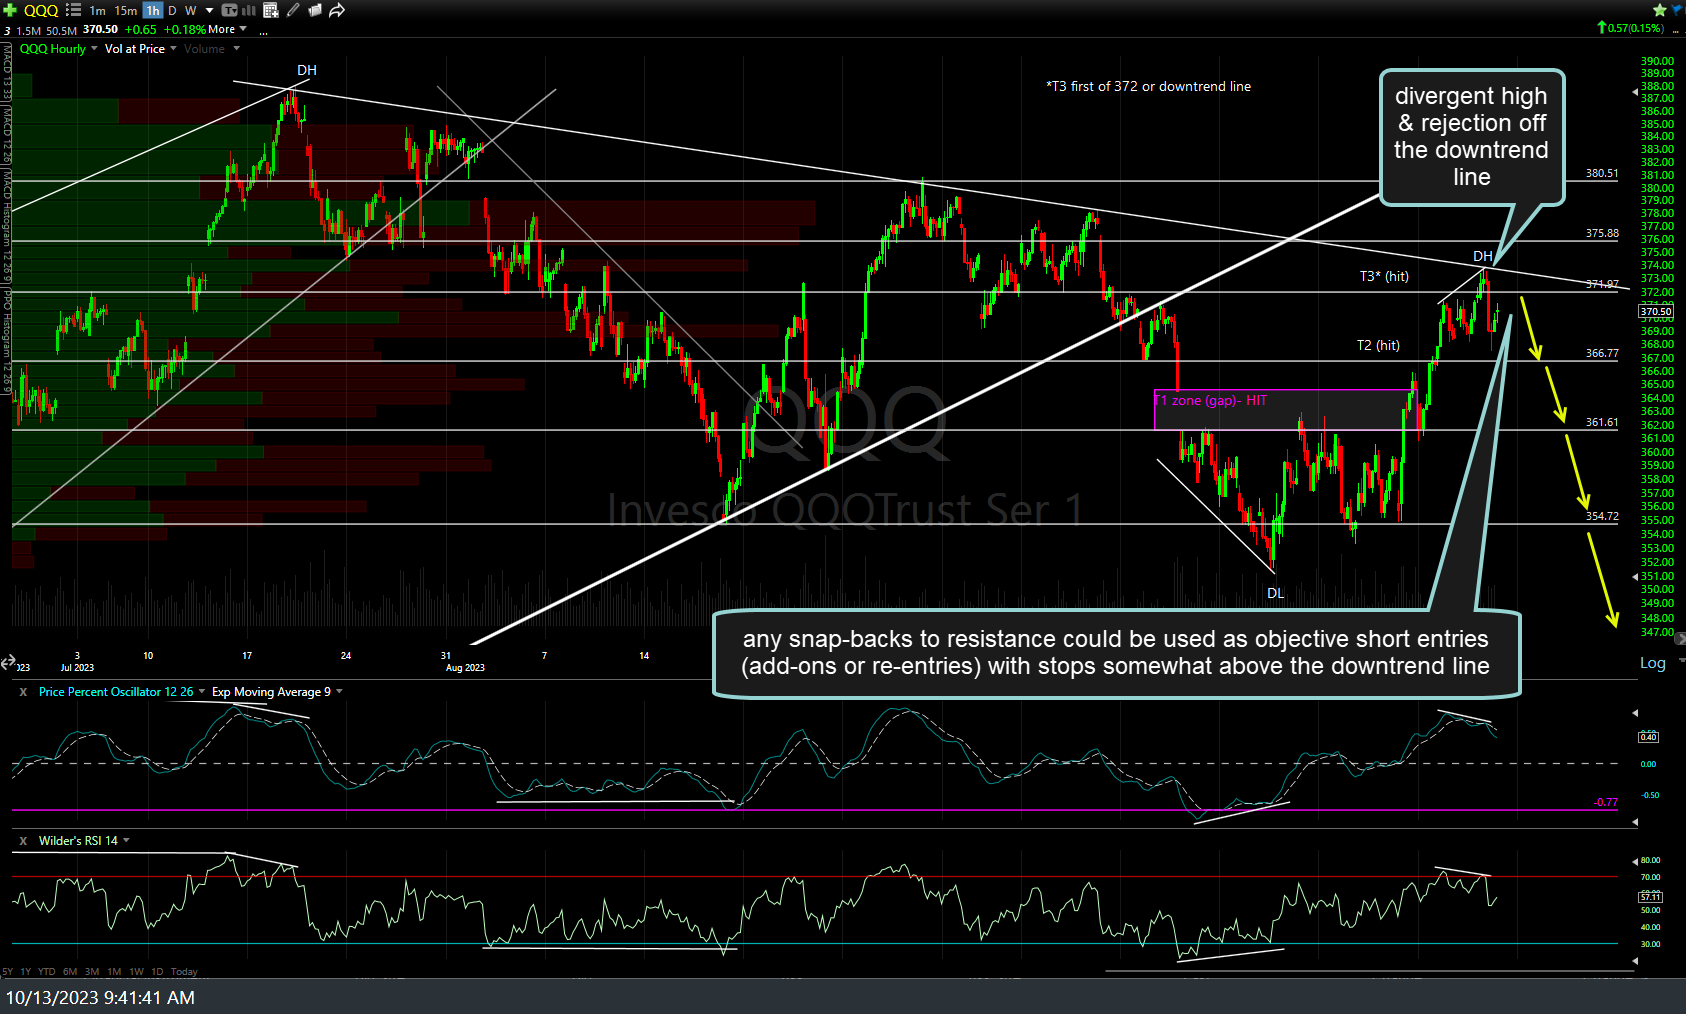
QQQ 60m Oct 13th
As covered in that previous video, yesterday’s divergent high & rejection off the downtrend line provided an objective short entry and/or level to close any longs taken off the recent divergent low (i.e.-at T3, the final price target for the recent long trade). It still appears that any snap-backs to resistance could be used as objective short entries (add-ons or re-entries) with stops somewhat above the downtrend line, as a solid & sustained break above it would likely spark additional upside to at least the 380.50ish resistance & potentially my “marginal new high” alternative scenario which I can’t eliminate (with a high-degree of confidence) until the key supports marked in purple on the Magnificent 7 stocks are taken out.
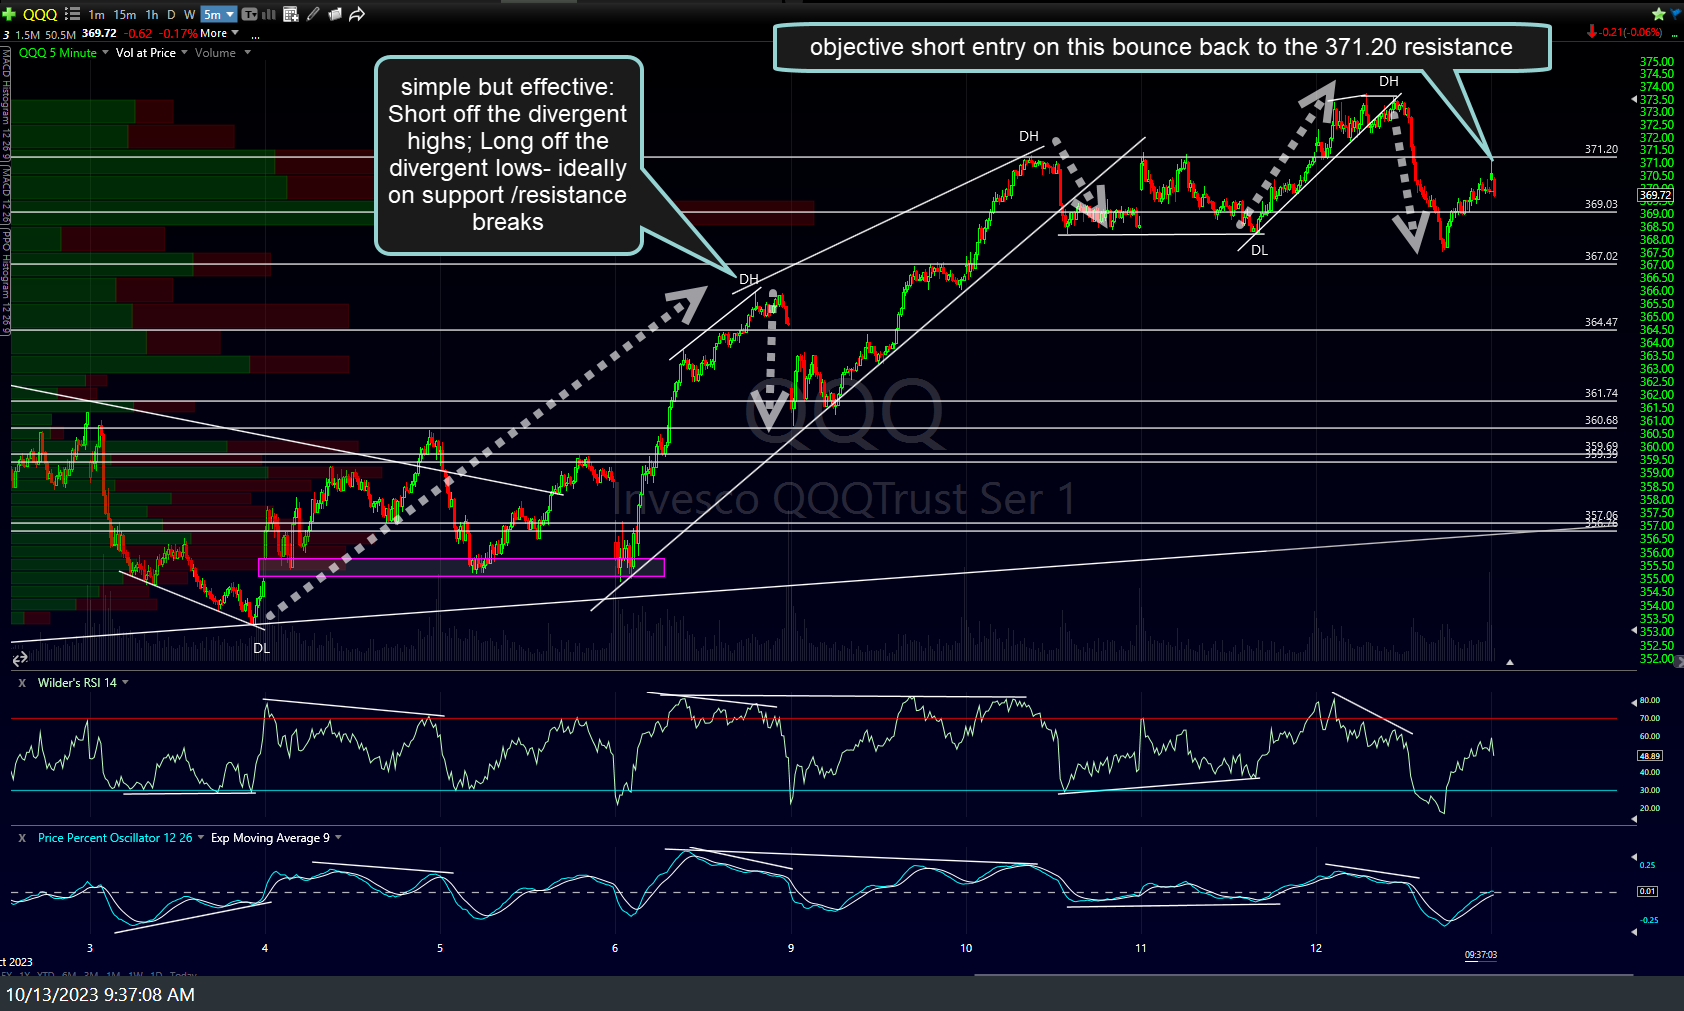
QQQ 5m Oct 13th
For active traders, the 5-minute chart of QQQ above show the simple but effective strategy that I’ve shared here many times in the past, one that works best in a mostly sideways market (as we’ve had for the past few months) but typically not so well when/if the purple supports on the Mag-7 are taken out and(if) the stock market begins a more powerful, unidirectional move down. Although this screenshot was taken before I started composing this post, QQQ is once again testing that 371.20 resistance level from below as I type, offering another objective short entry or add-on.
Active traders might opt to use a relatively tight stop place somewhat above the 372 level (as a pop above will likely spark at least a near-term rally) while typical swing traders might use a stop on a solid 60-minute or daily close (my preference) above the primary downtrend line off the July 19th highs.