
This 15-minute chart of QQQ highlights several key near-term support & resistance levels. A solid break above the R2 level (114.80) would likely open the door to a re-test of the early November/all-time highs while a solid break below the downtrend line and the S2 level (113.95) would likely usher in the next wave of selling. One thing to keep in mind is that as volumes start to drop off head of next week’s abbreviate holiday trading week, the chances of whipsaw signals increases substantially. With that being said, here’s the chart with those key near-term support & resistance levels as well as a couple of near-term price targets.
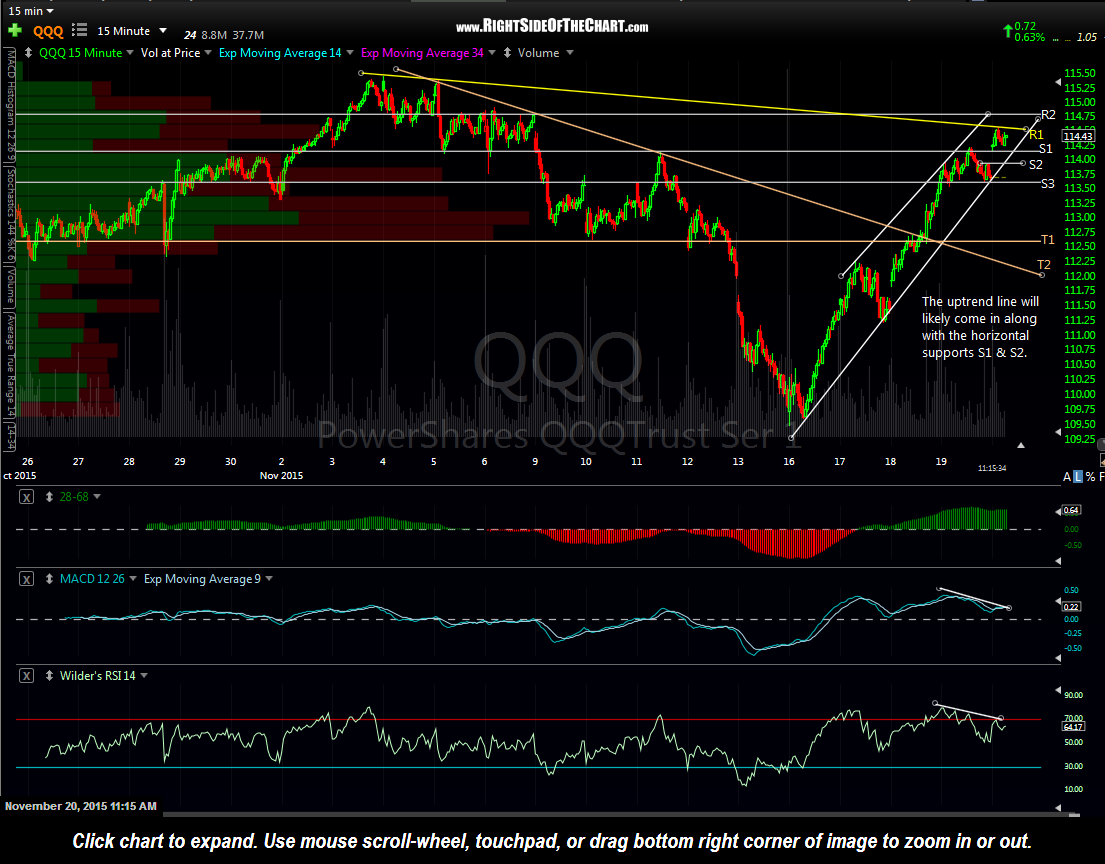
QQQ 15 minute Nov 20th