
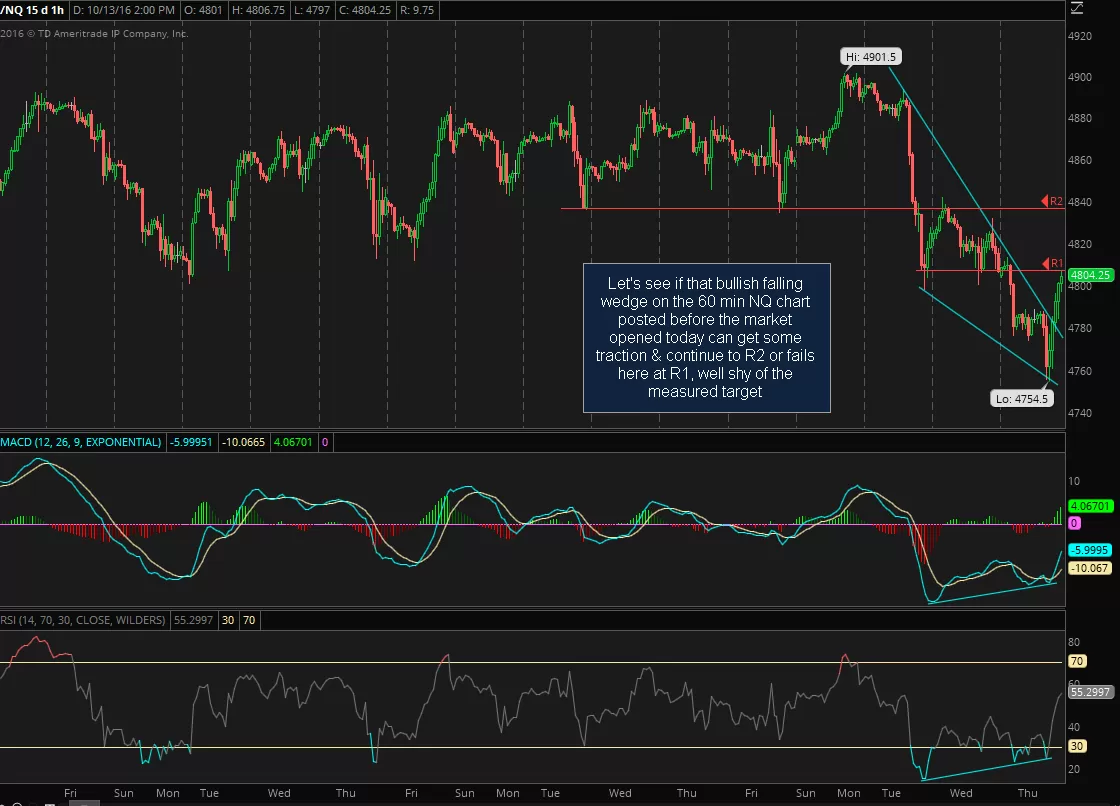
Let’s see if that bullish falling wedge on the 60 min NQ chart posted before the market opened today (first chart below) can get some traction & continue to R2 or fails here at R1, well shy of the measured target. The reversal in NQ at the bottom of the wedge earlier today coincided that that reaction of the 116 key support on QQQ. With an just over an hour left in today’s trading session, are there enough buyers left in the market to close the markets above today’s gaps or will the remaining longs use this technically induced bounce to dump their positions with a nice sell-off into the close today? My money is on the latter but we should know soon enough.
-
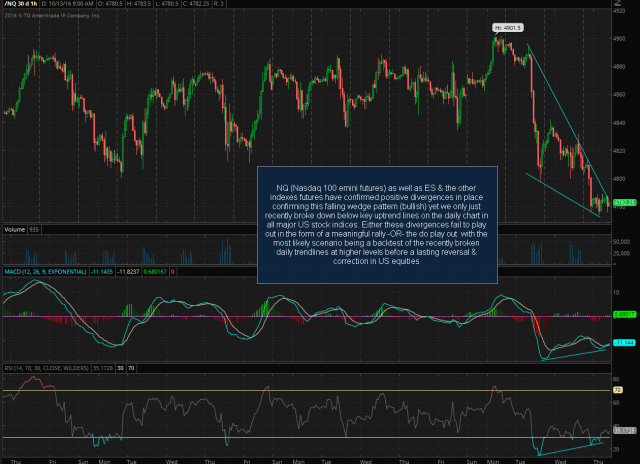
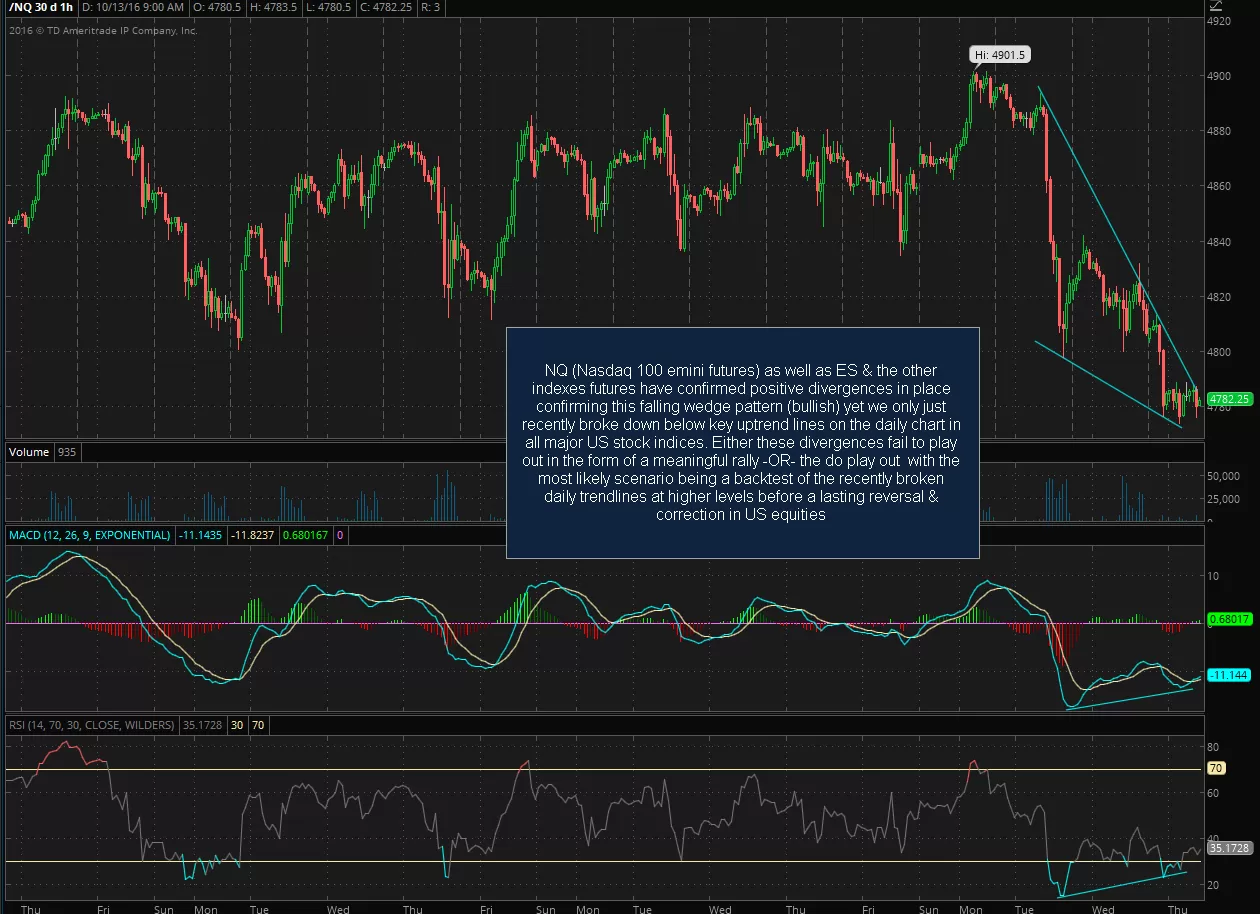
- NQ 60-minute Oct 13th
-

- NQ 60-minute 2 Oct 13th
A break below this intersecting uptrend line + 116.98 support in QQQ should spark the next wave of selling (1-minute chart) with a likely reaction at 116.70 along the way to the next & final visit t0 116.00 before that level is taken out with conviction.
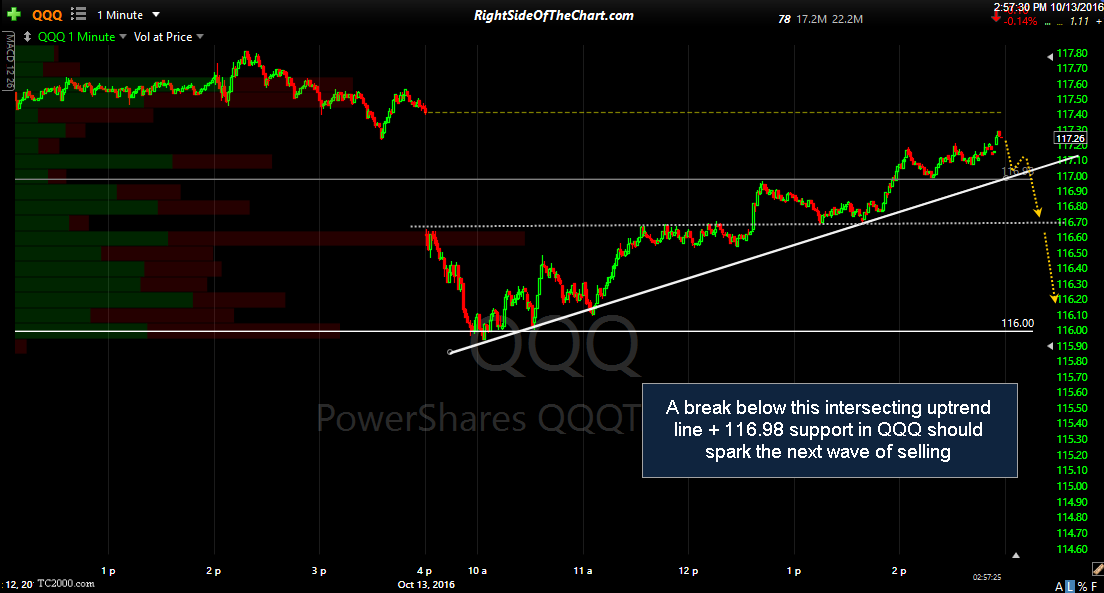
QQQ 1-minute Oct 13th