
After a near-perfect tag of my final 60-minute target first posted back in February just before the 12% correction in /NQ (first chart below from February 4th) with bullish divergences in place at the time, /NQ reversed to rally up to the 13131 former support, now resistance level where it was rejected with /NQ currently backtesting the downtrend line off the February 15th highs.
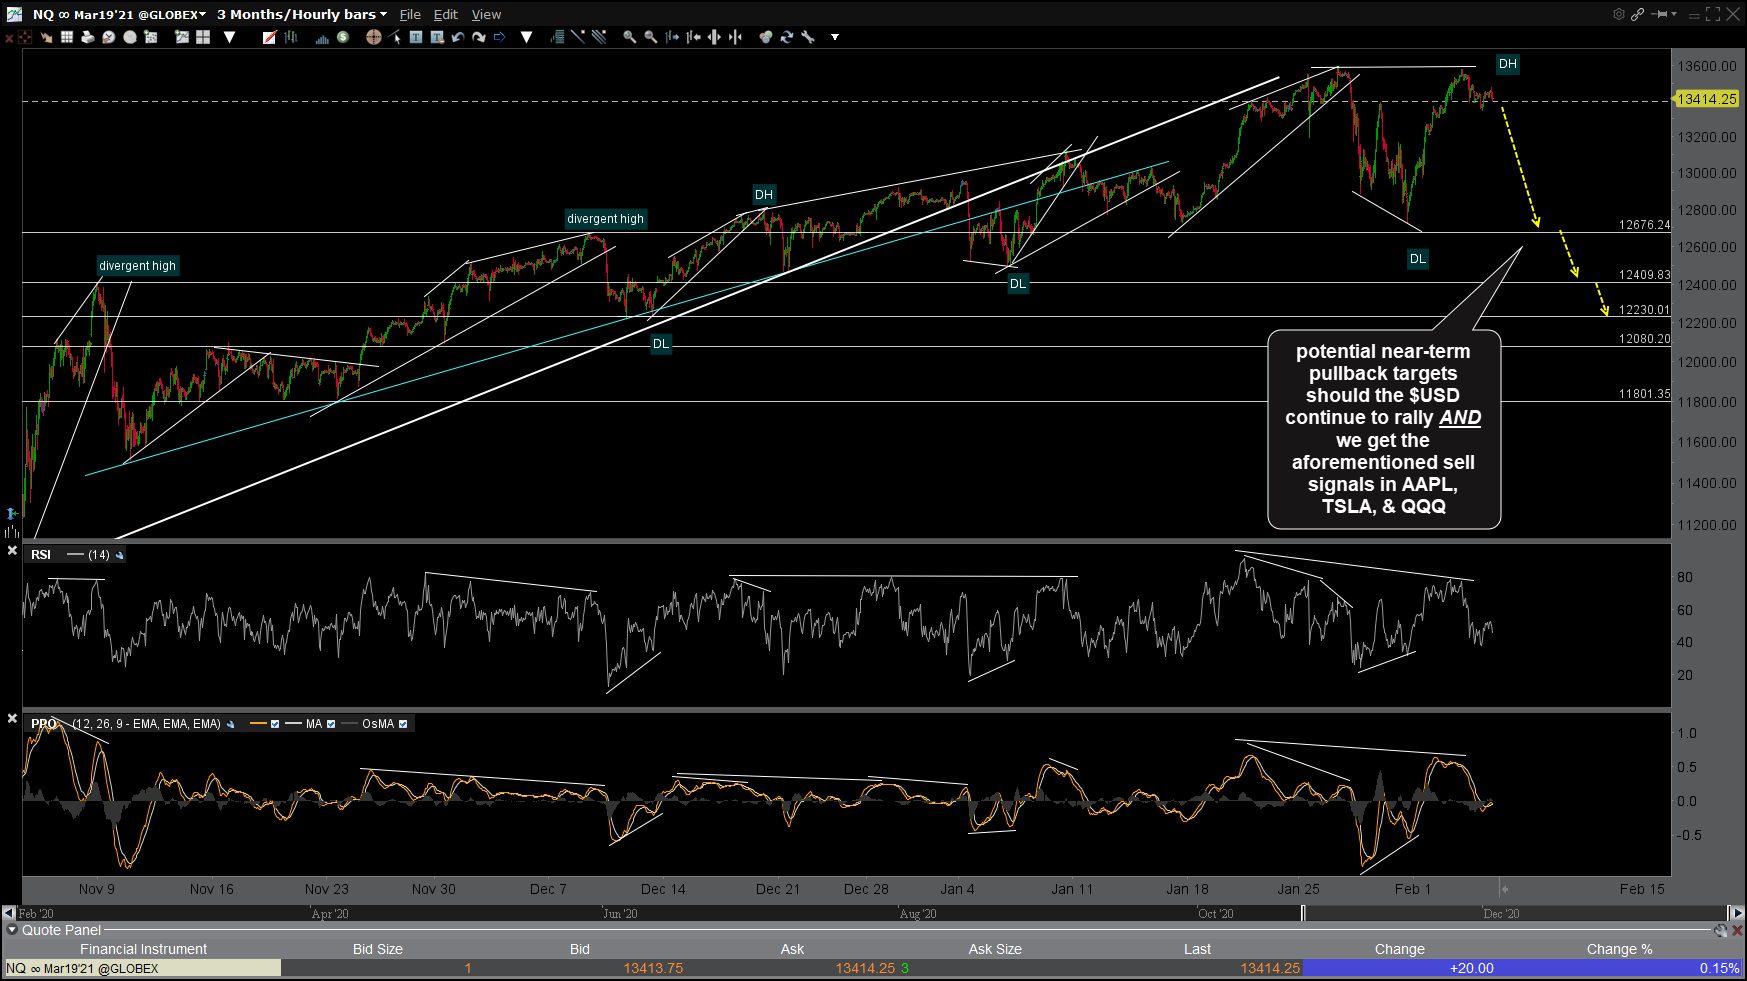
NQ 60m Feb 4th
/NQ 60-minute chart from March 4th reiterating a likely continued drop to the 12230 price target:
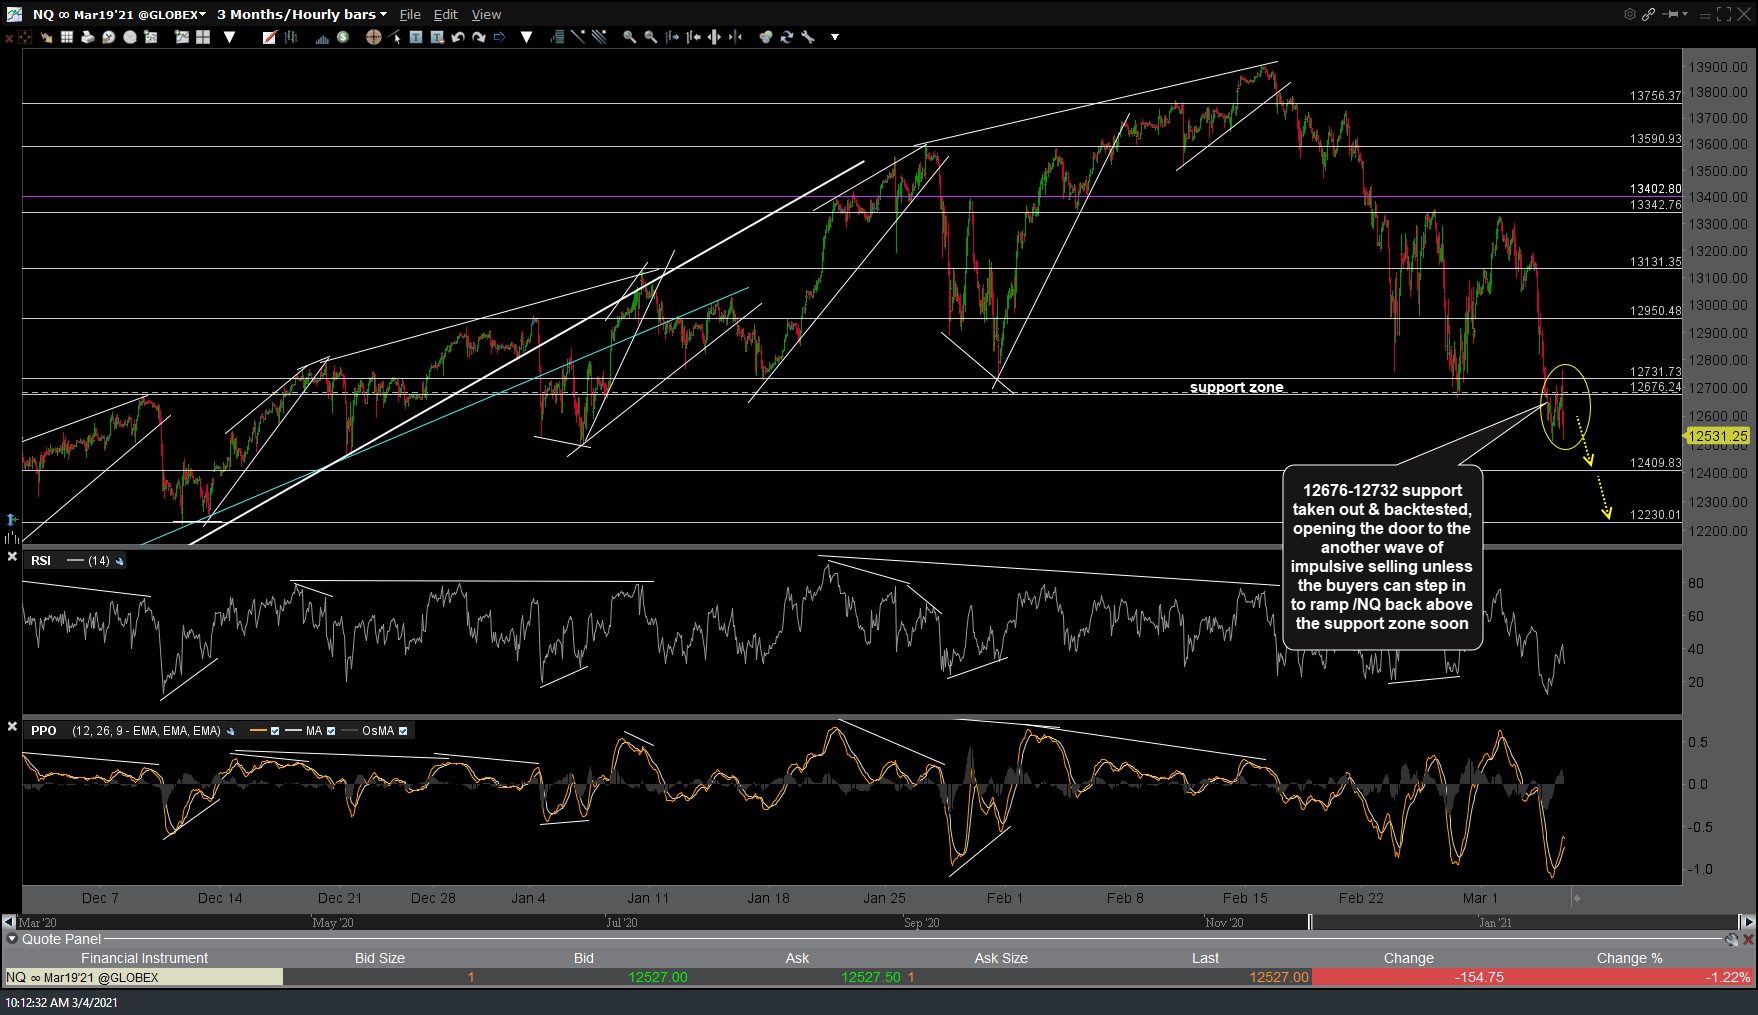
NQ 60m March 4th
Updated /NQ chart as of today’s pre-market session. Essentially, this is a pullback to support (downtrend line) so near-term bullish if /NQ holds above & reverses of the trendline, bearish if it falls back solidly below it with 12676 the next support level to watch if so.
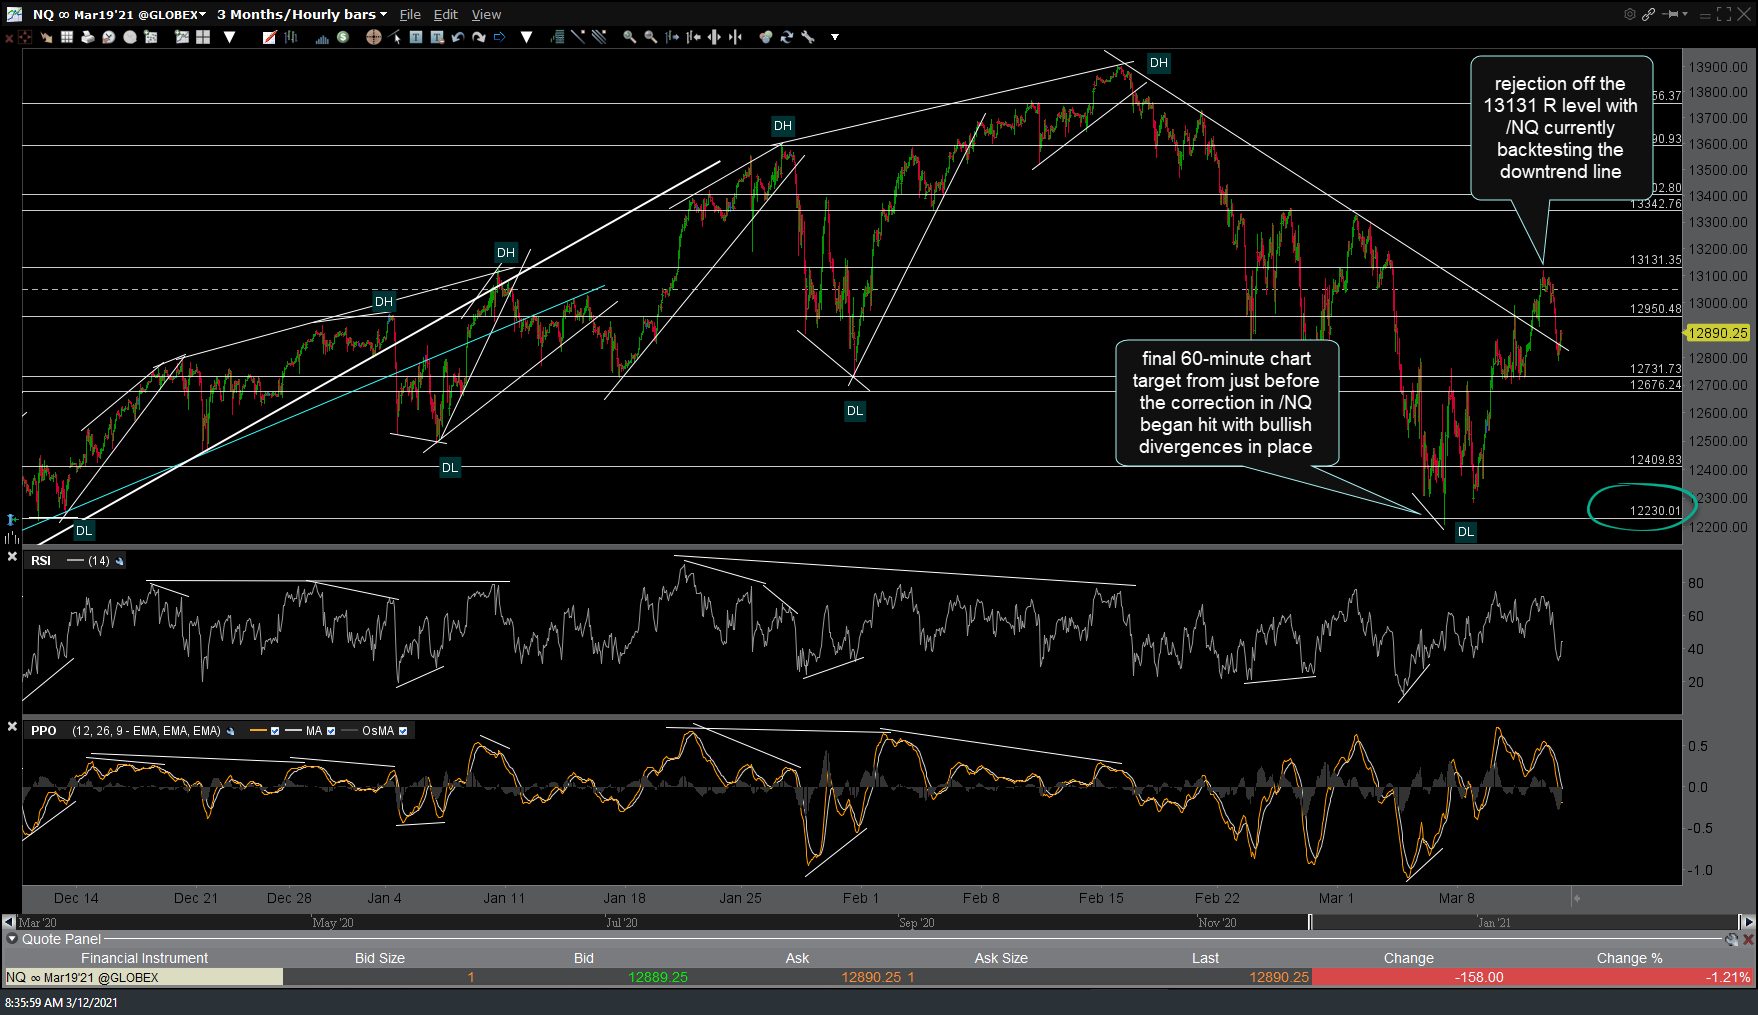
NQ 60m March 12th
The first chart below is the QQQ daily chart posted back on February 18th, 2-days after QQQ peaked & begin the 12% correction that ended with a near-perfect tag of the 297 price target laid out at the time.
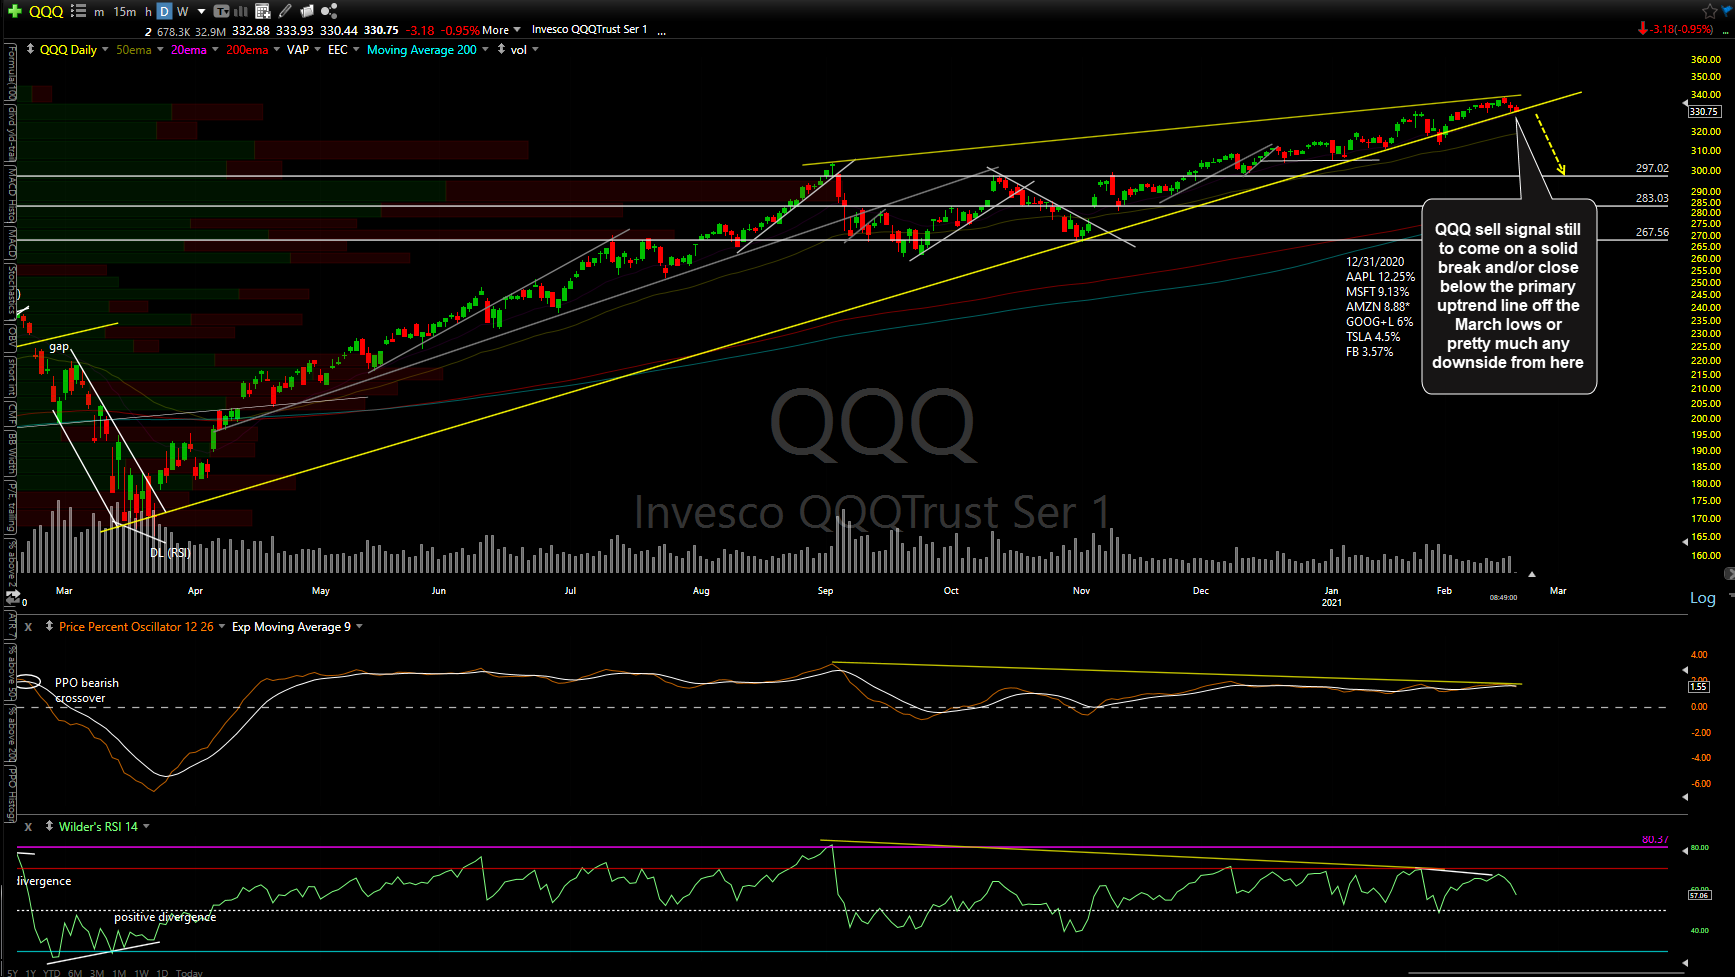
QQQ daily Feb 18th
The 297 price target was hit last Friday followed by the typical reaction so far. That could be the end of the correction although it still appears that the odds favor that this is a counter-trend rally with another leg down to come vs. the start of the next leg to a marginal new high.
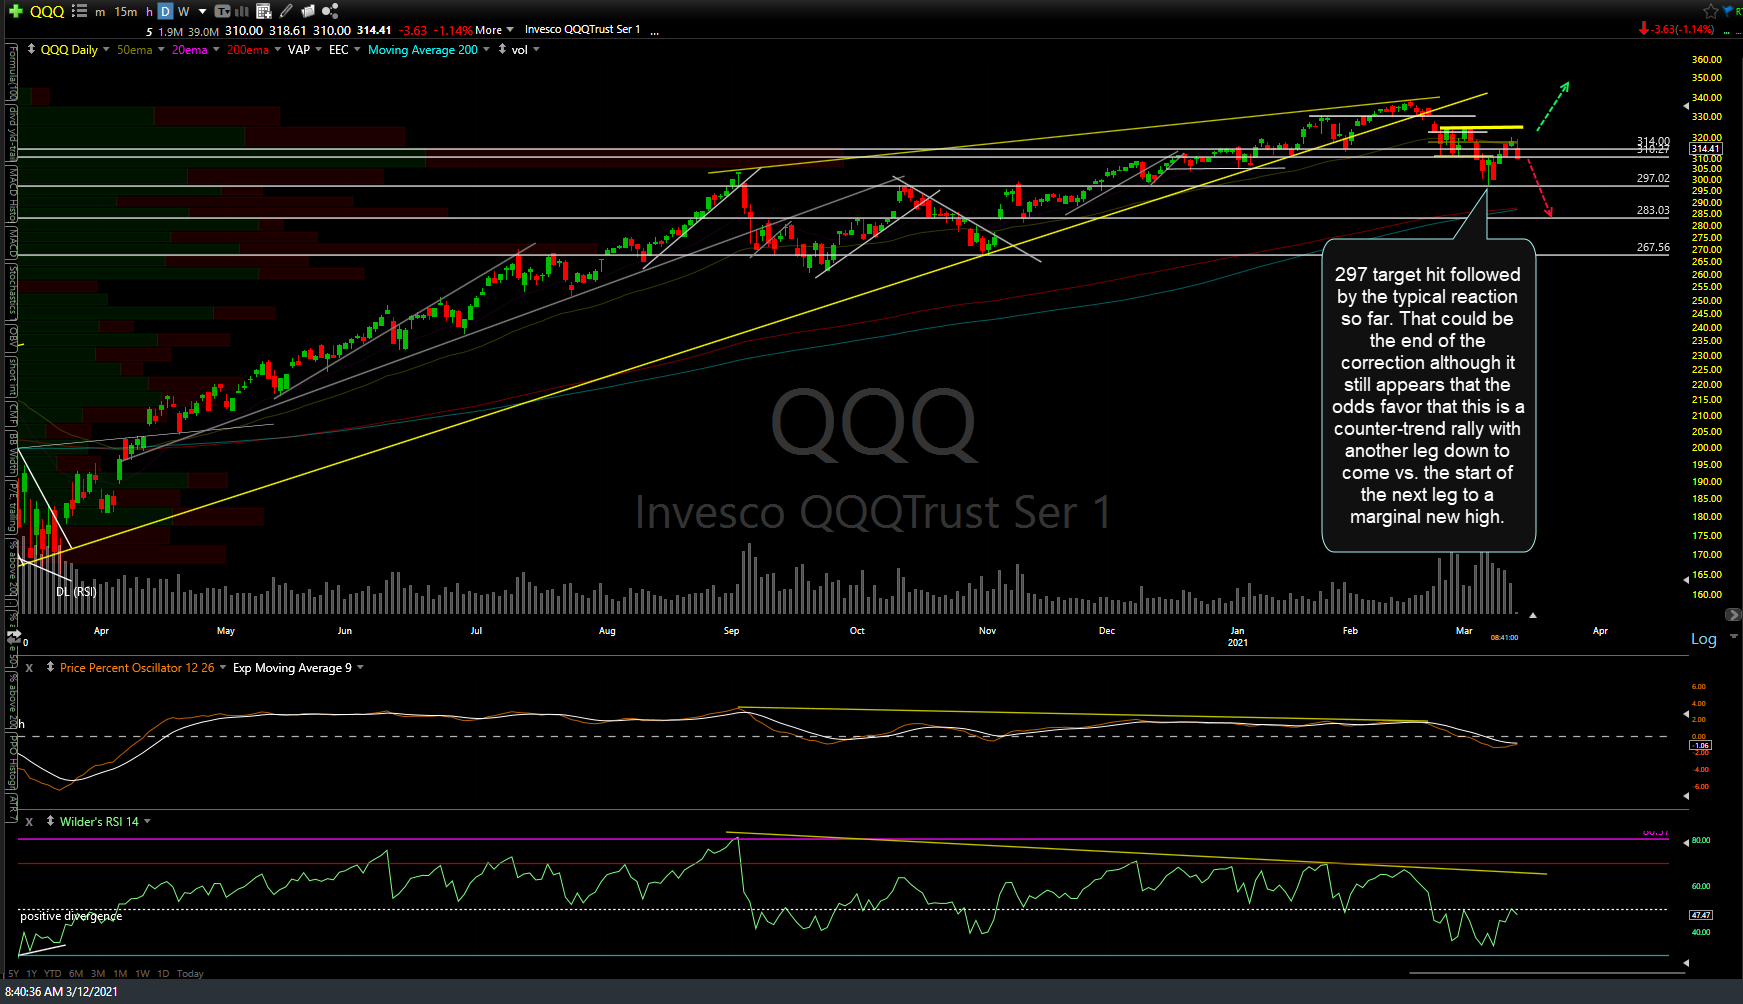
QQQ daily March 12th
With not just the Nasdaq 100 but numerous large-cap stocks in various sectors also hitting & reversing off major support last week, it is certainly possible that Friday marked the end of the correction although based on many of the extreme conditions & sell signals covered in recent weeks, a decent case for another leg down can still be made.
With today being Friday & the major stock indices as well as all of the top S&P 500 & Nasdaq 100 stocks recently highlighted trading comfortably above the key support levels they reversed off of last week, we’ll probably have to wait to see how the market trades next week to glean any decent clues as to whether or not the rally over the past week is likely the start of the next leg to new highs in the market ($SPX as well as $NDX) or simply a counter-trend rally in a much larger correction with more downside in the coming weeks. First things first so let’s see how /NQ handles this backtest of the recently broken downtrend line.