
In yesterday’s video, I highlighted a simple, yet effective method for predicting likely near-term pullbacks during a rally using the PPO (or MACD) and RSI on the intraday charts. This 30-min chart of QQQ shows all of the “clean” bearish crossovers on the PPO with those that come in conjunction with overbought (70+ readings on the RSI 14) in red as well as the bearish PPO crossovers that came when the RSI was close to but below the 70 level. Note the subsequent pullbacks in QQQ in every instance in recent months.
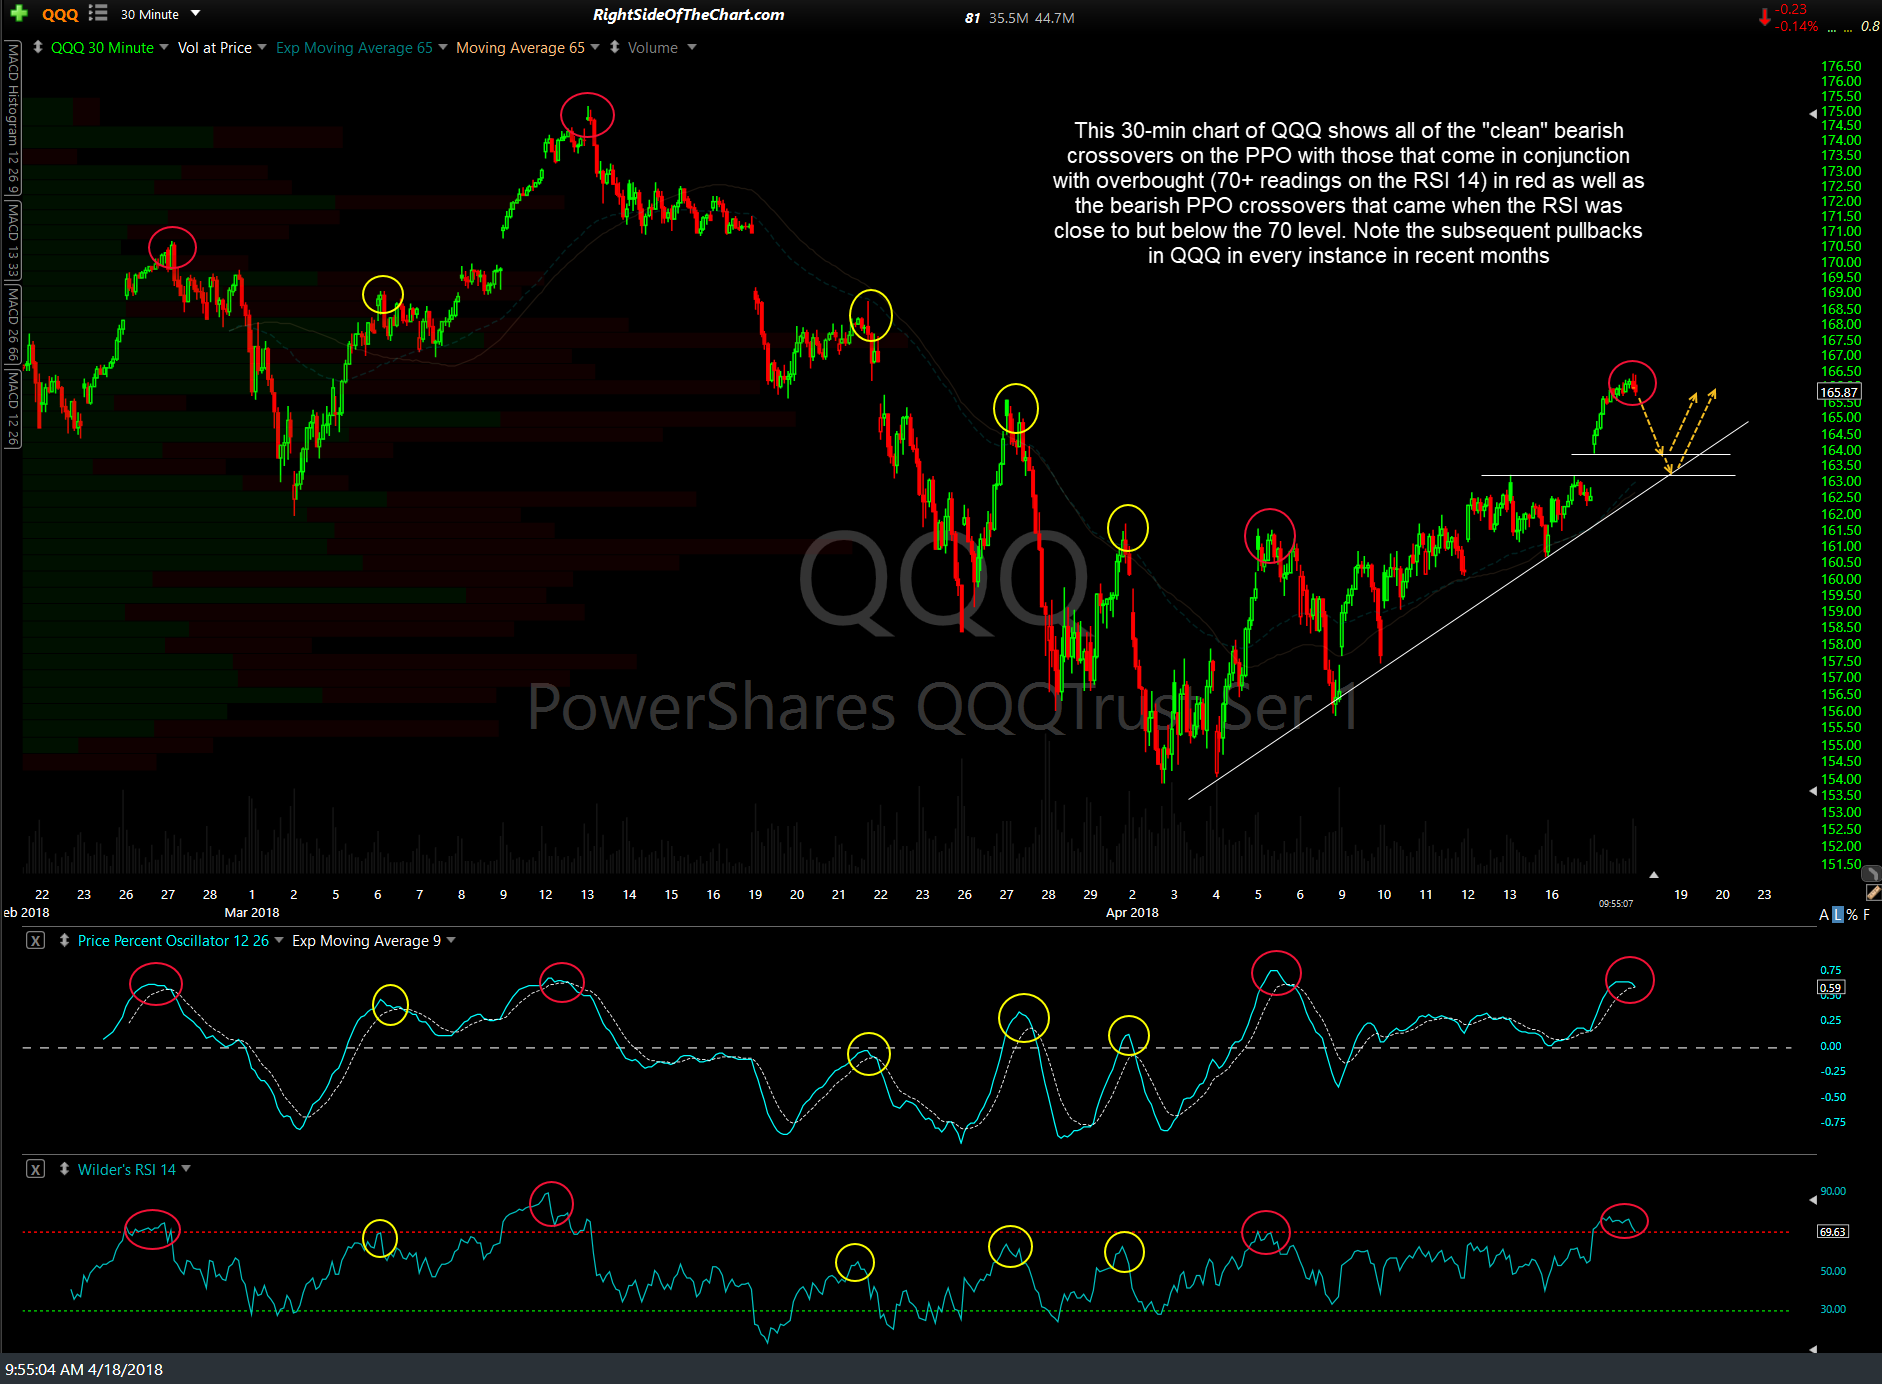
QQQ 30-min April 18th
As of now, my expectation remains for a relatively minor pullback to test either the top or bottom of yesterday’s gap which would translate into a pullback of about 1.5% – 2.2% off yesterday’s high in QQQ put in shortly before the close.