
On a relatively small number of occasions over the years I have posted updates on what I refer to as my “Low-volume Indicator”. I developed the indicator using a 10-day (exponential) moving average of the daily volume of the major stock indices, primarily QQQ & SPY. The last time I posted my QQQ low-volume sell signal triggering was Sept 6th (that chart below), with QQQ falling 10% from there.
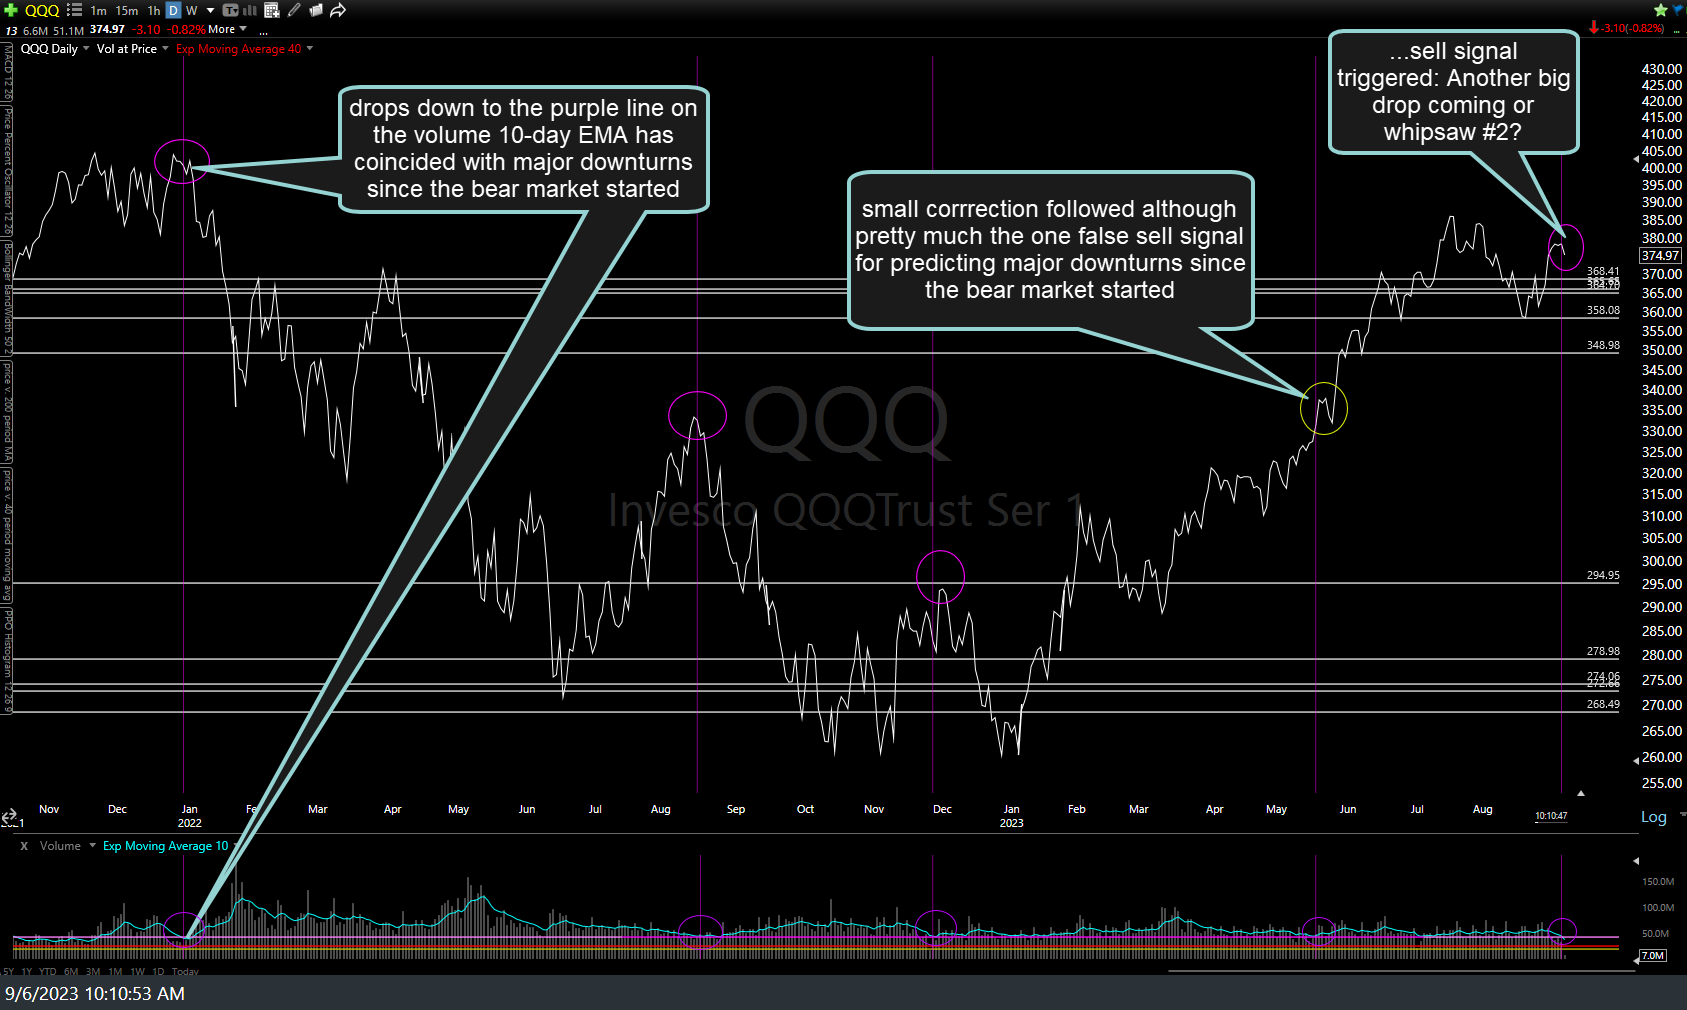
QQQ low-volume indicator Sept 6th
The QQQ low-volume sell signal triggered on a daily closing basis for the first time since then on Friday. While the Friday was an abbreviated (1 pm EST close) trading session coupled with a typically low-volume Thanksgiving holiday trading week, the indicator is based on a 10-day moving average vs. any single day drop & as such, a signal is a signal so it either plays out with a correction starting soon (this week or next, at latest) or not.
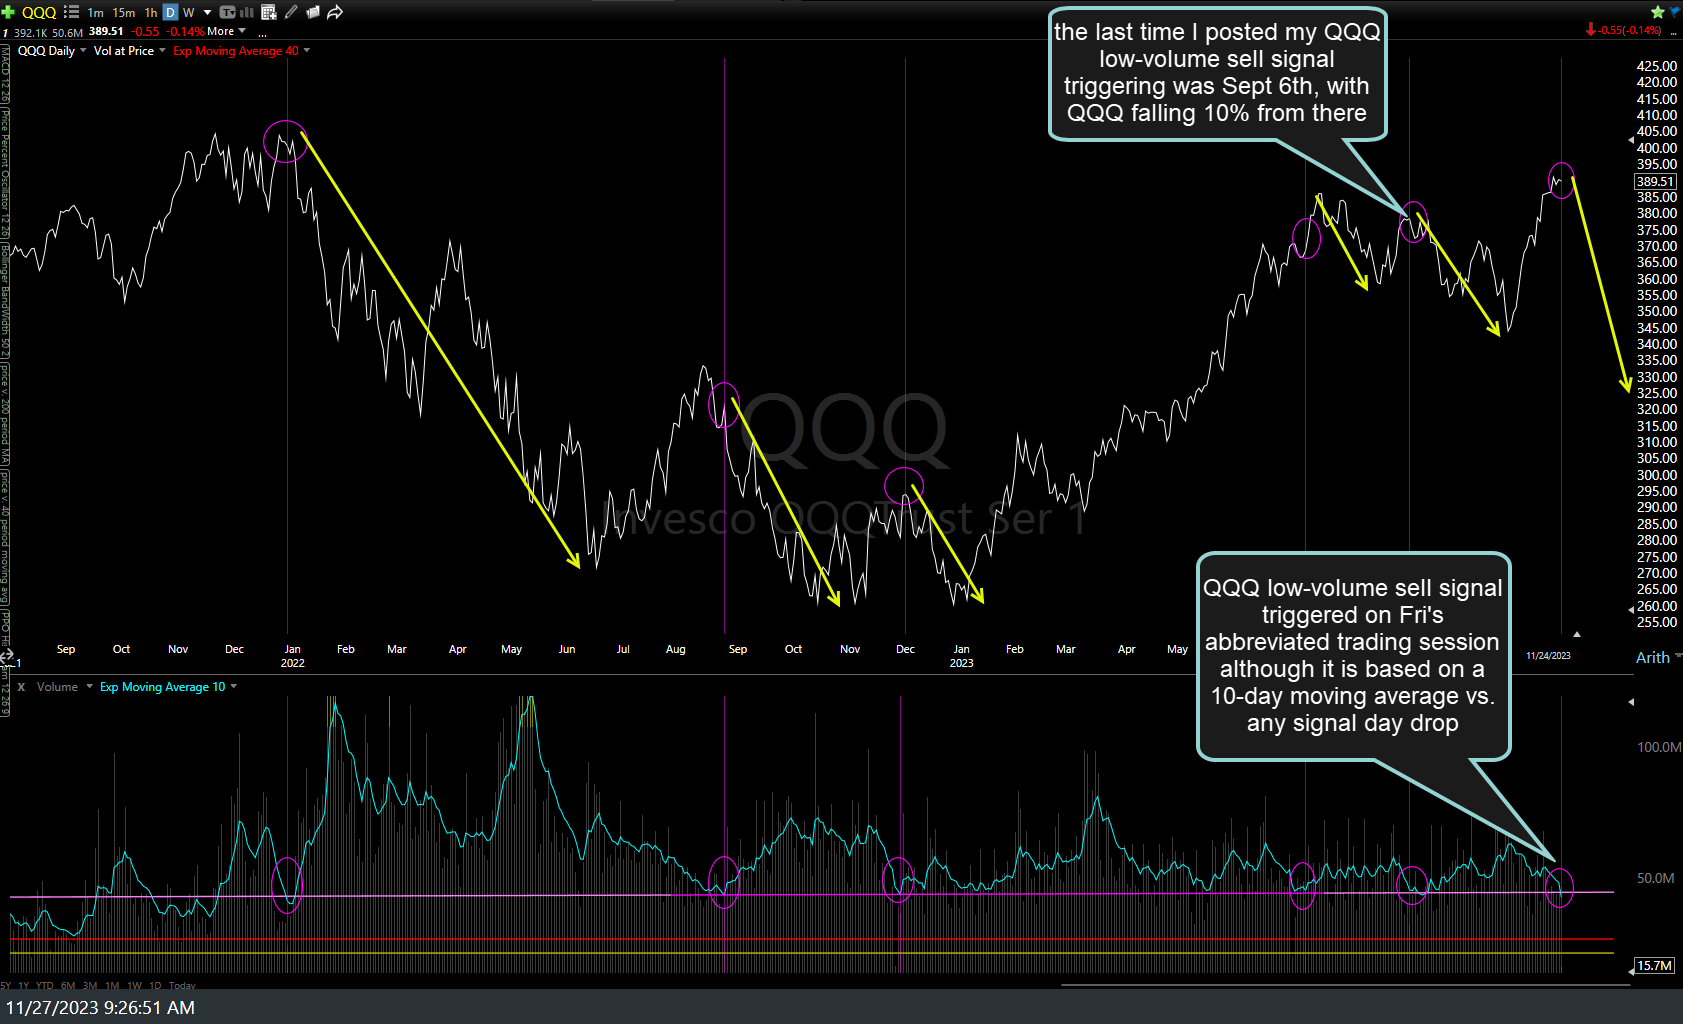
QQQ low-volume indicator Nov 27th
As far as the “other technicals”, nothing changed while I took some time off to spend with my family last week. The negative divergences continue to build & remain very much intact on the 60-minute (below), daily, & weekly charts of QQQ, still indicating the likelihood of an impending trend change until & unless these divergences (and those on the S&P 500 and equal-weighted indexes) are taken out. If the turn comes this week, the top & bottom of the Nov 14th gap would be the most obvious & likely initial price targets.
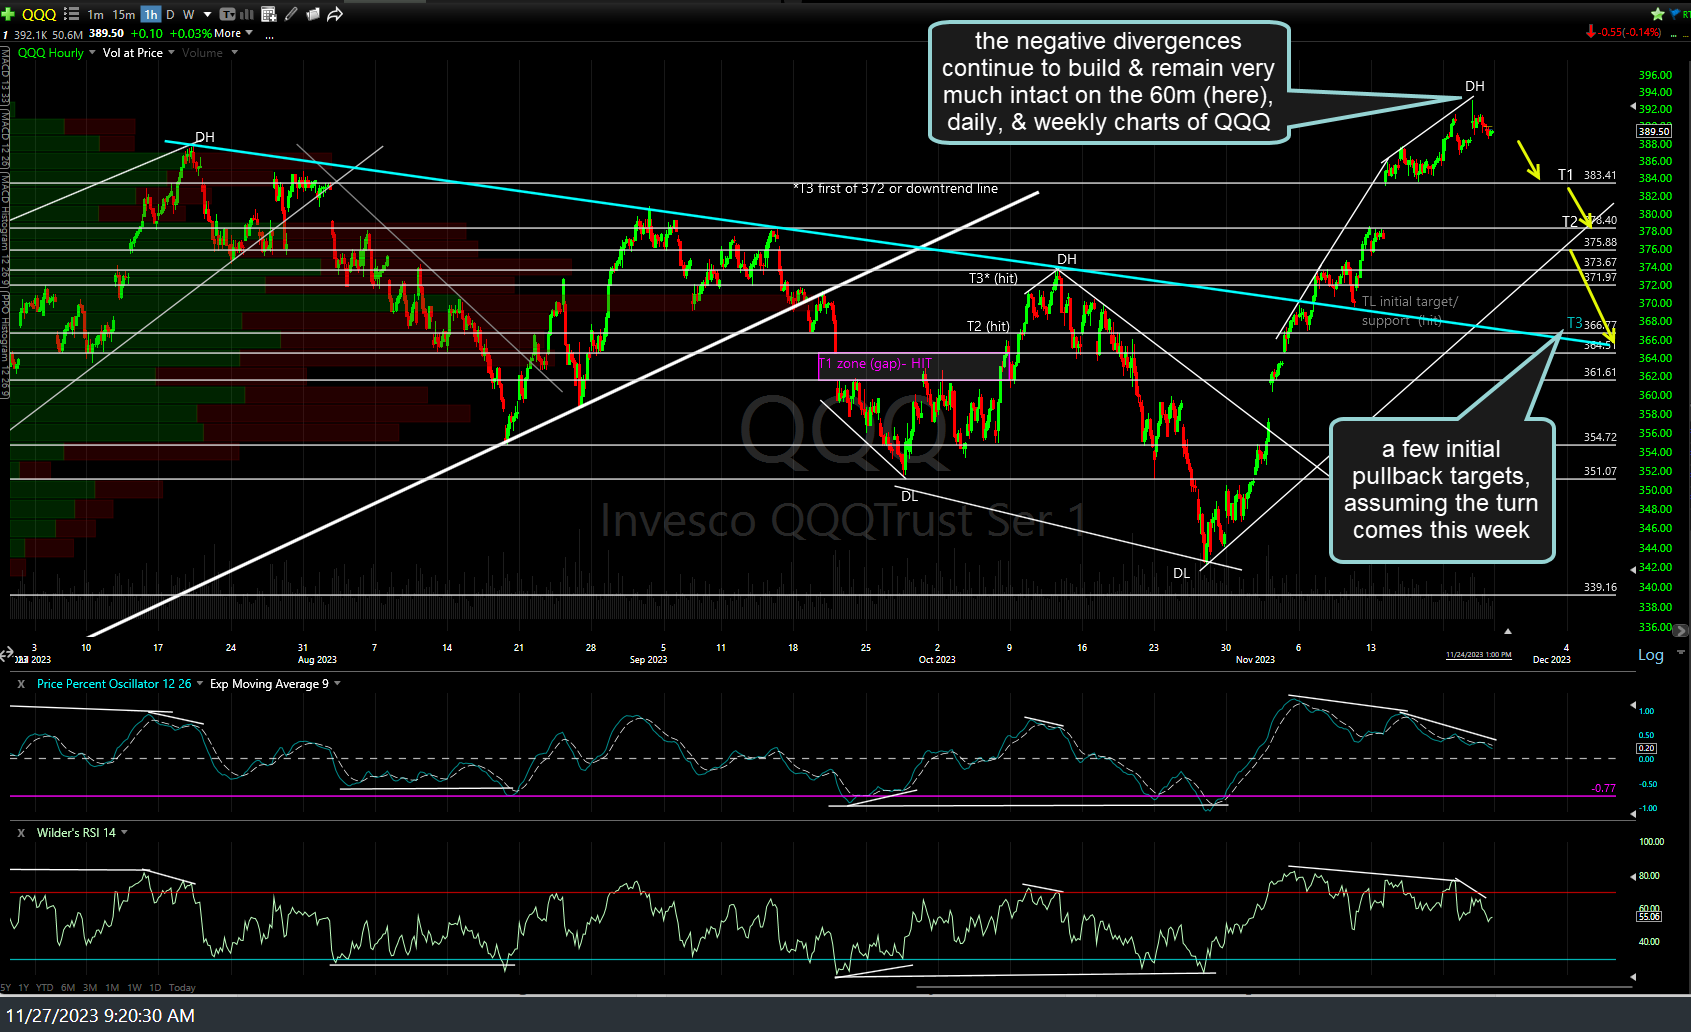
QQQ 60m Nov 27th