A follow-up to Tuesday’s QQQ & FAAMG Stock Analysis video. All charts are 60-minute time frames except for AAPL (Apple Inc), which shows a 120-minute period chart in order to capture the entire, well-defined uptrend line generated off the November 14, 2016 lows. Charts posted in descending order by market cap. Click on first chart (QQQ) to expand, then click anywhere on the right of the chart to advance to the next expanded image. Once expanded, charts can be panned & zoomed.
-
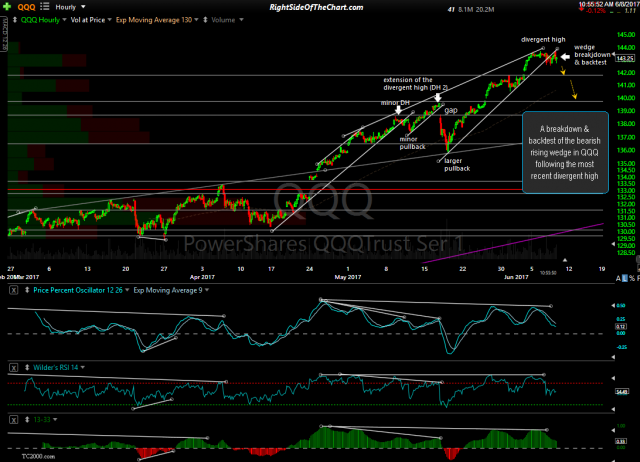
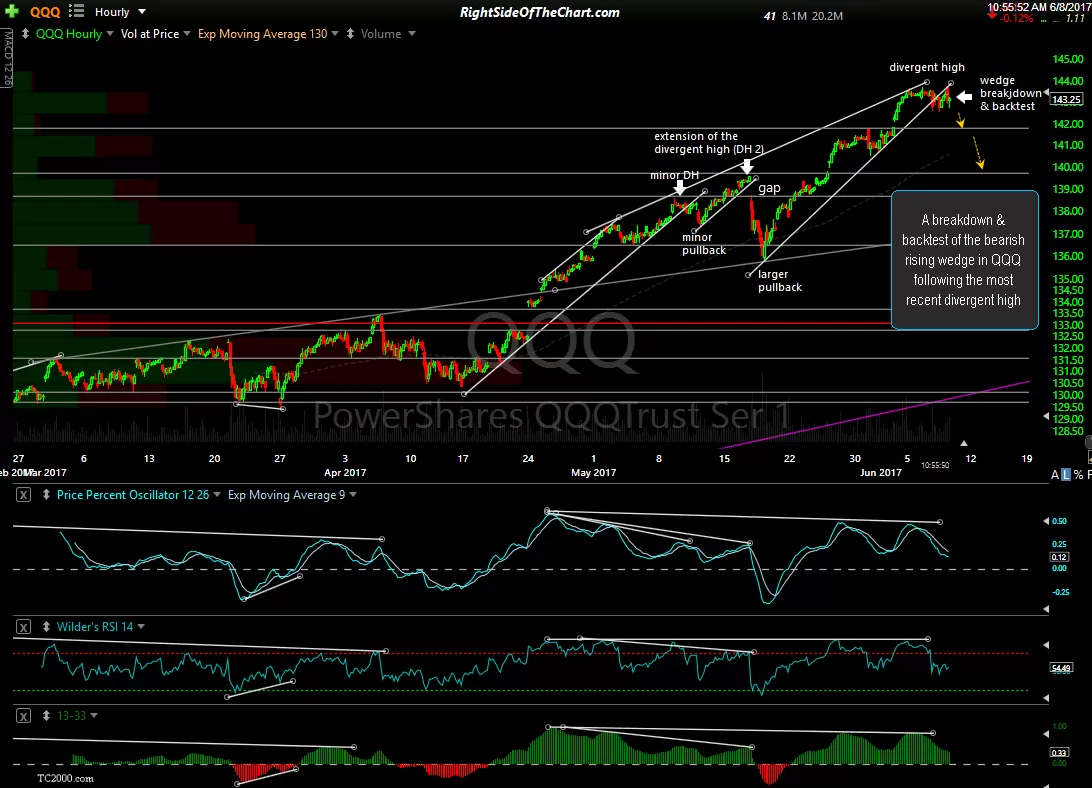
- QQQ 60-minute June 8th
-
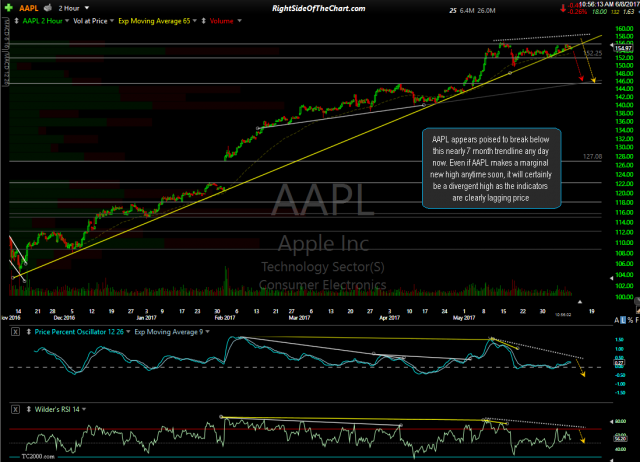
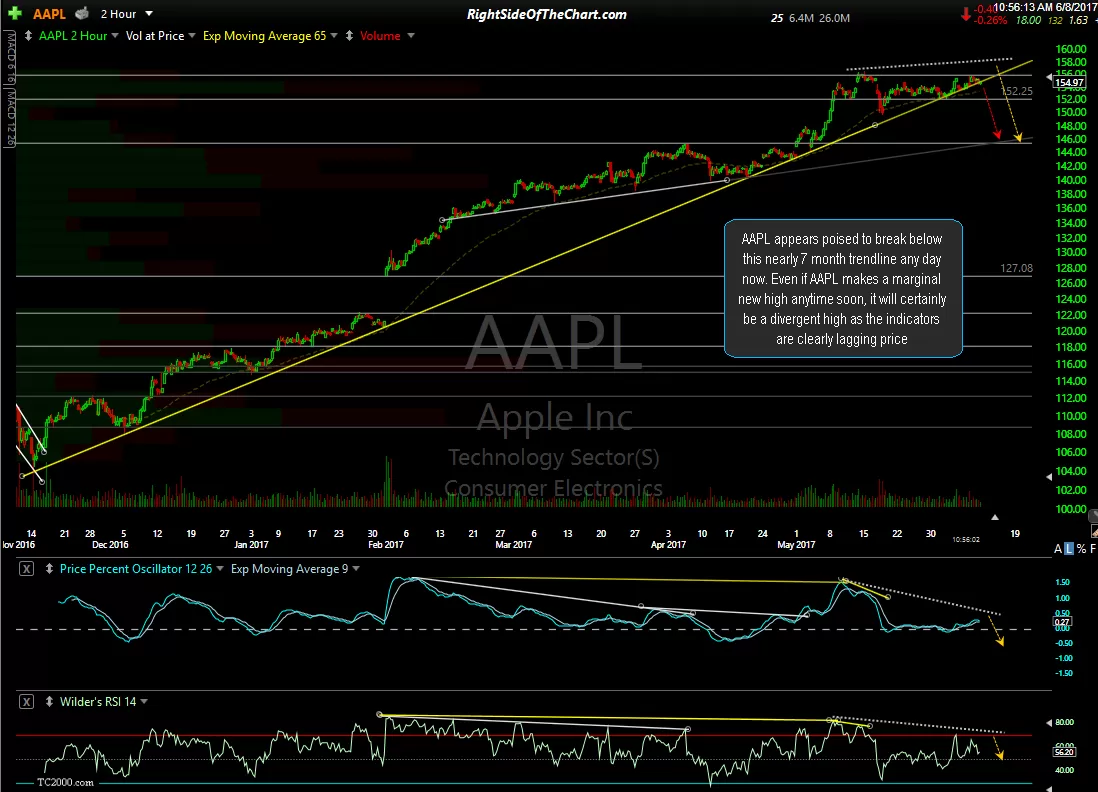
- AAPL 120-minute June 8th
-
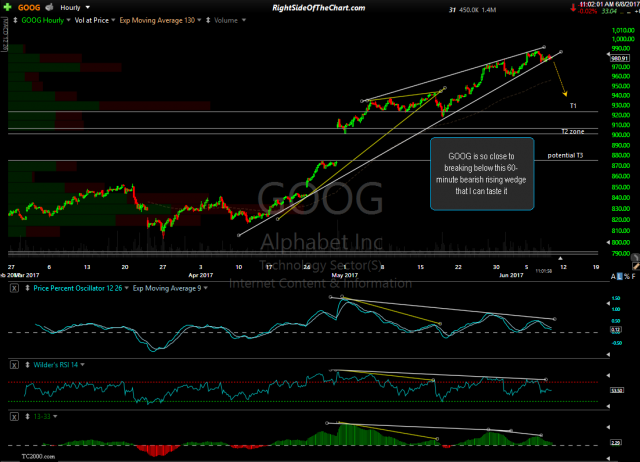
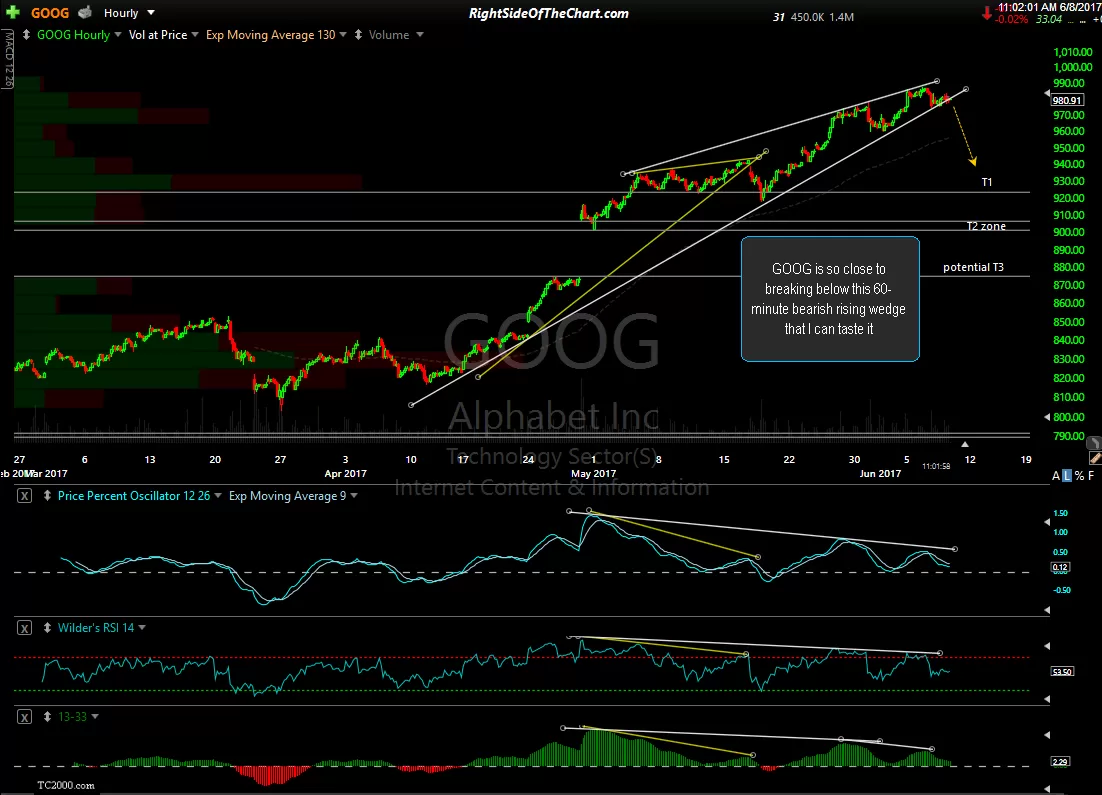
- GOOG 60-minute June 8th
-
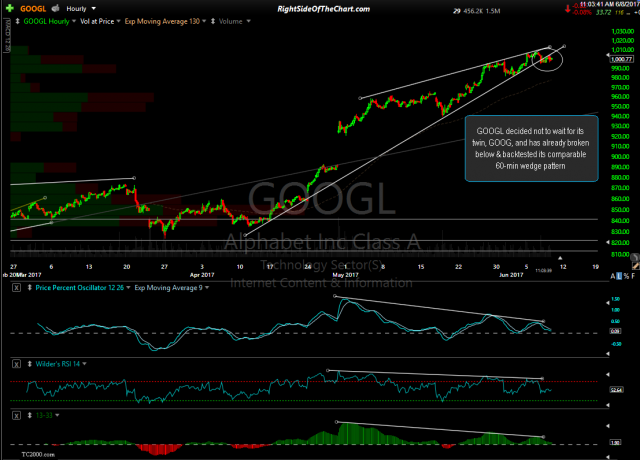
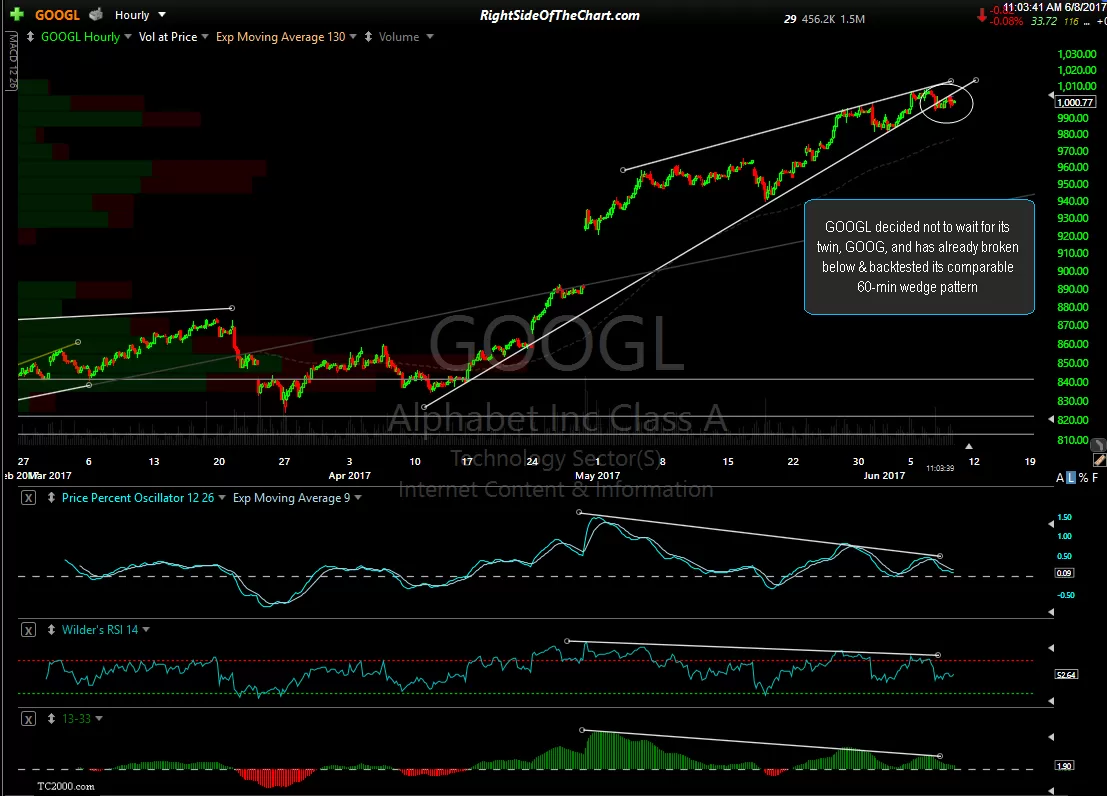
- GOOGL 60-minute June 8th
-
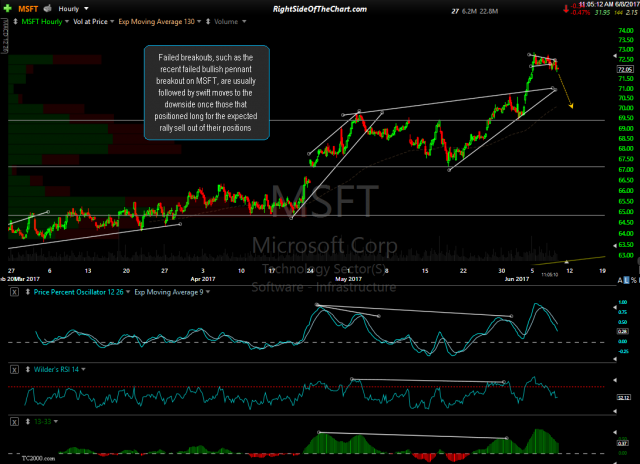
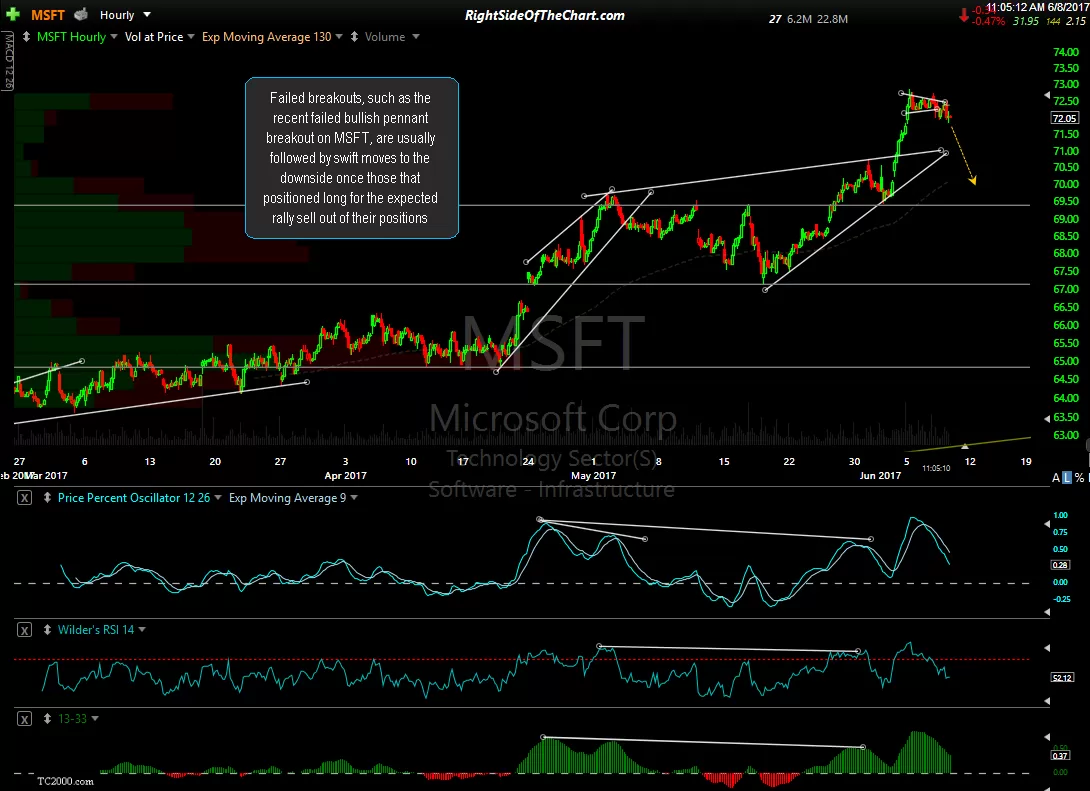
- MSFT 60-minute June 8th
-
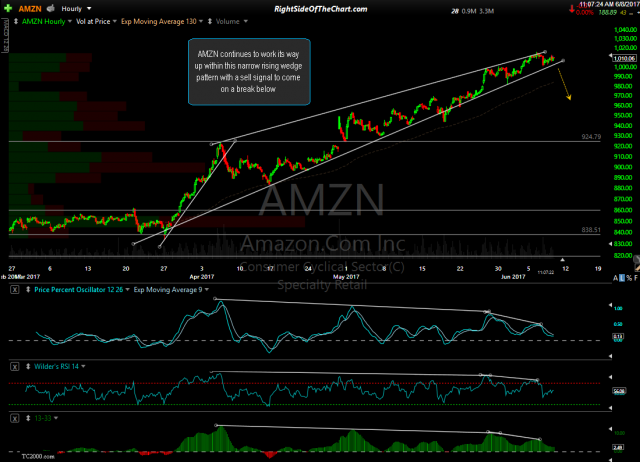
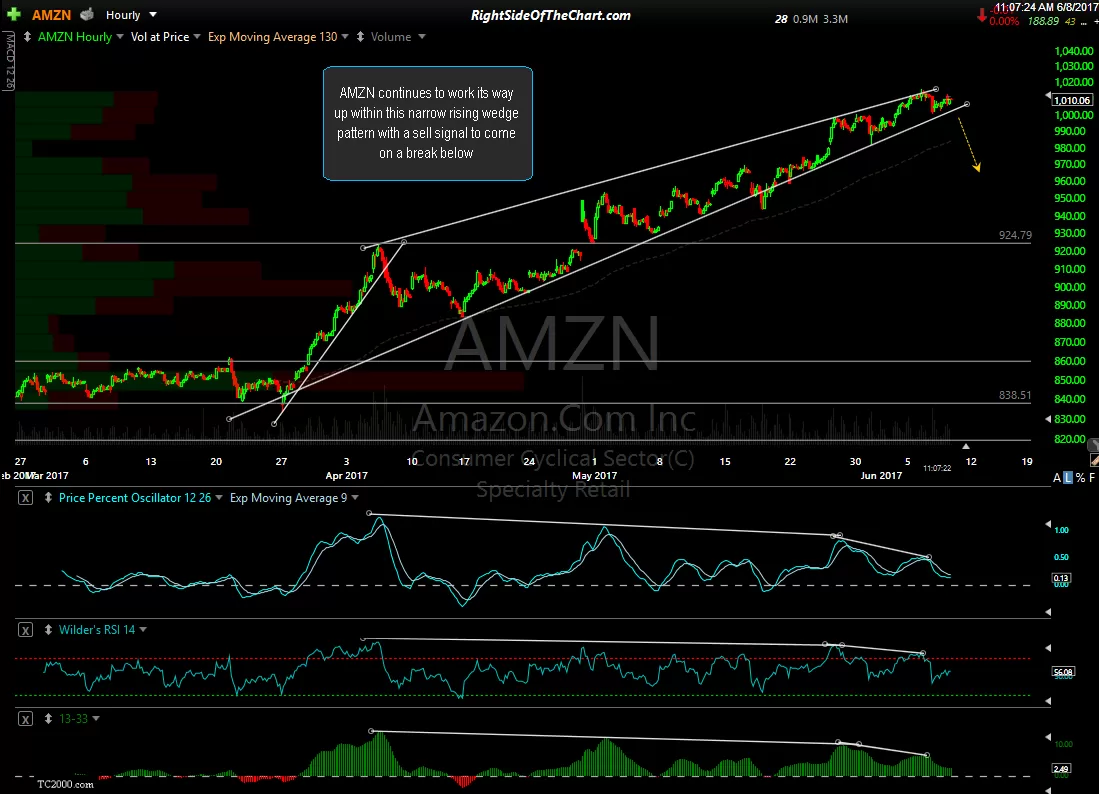
- AMZN 60-minute June 8th
-
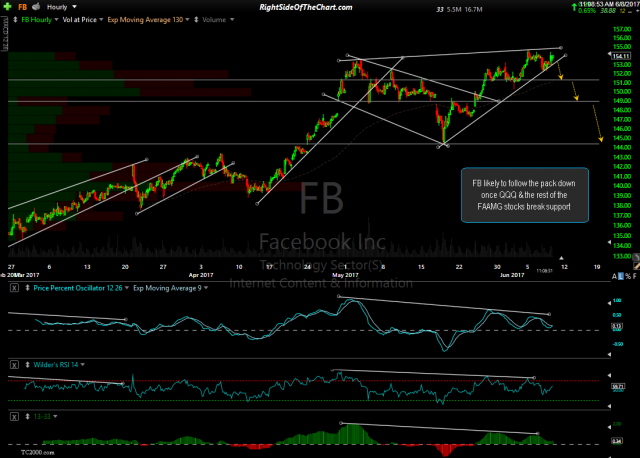
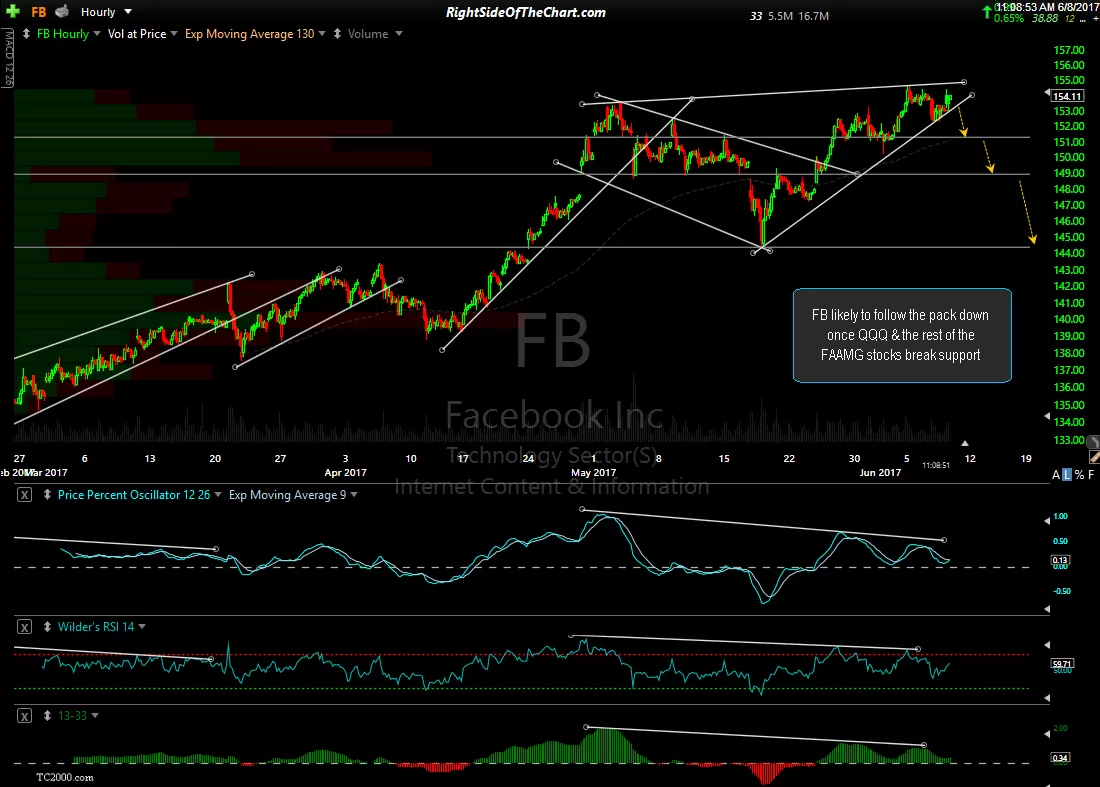
- FB 60-minute June 8th